The Mathematical Blueprint for Home Affordability, Debt-to-Income (DTI) Ratios & Mortgage Feasibility in 2026
From the 28/36 Underwriting Rule and PITI Stack Analysis to Down Payment Opportunity Costs, Interest Rate Purchasing Power Elasticity, and Reserve Liquidity Sinking Funds—The Complete 5,000+ Word Financial Playbook.

INNO XPERT Quantitative Systems GroupVERIFIED
Real Estate Quantitative Economics & Mortgage Underwriting

Home affordability is not determined by the listing price of a property or your gross annual salary alone—it is governed by the strict mathematical underwriting standards of Debt-to-Income (DTI) ratios and complete PITI (Principal, Interest, Property Taxes, and Homeowners Insurance) monthly liability stacks. Commercial mortgage lenders universally apply the 28/36 Rule: no more than 28% of your gross monthly income should be allocated toward housing costs (Front-End DTI), and no more than 36% should be allocated toward total monthly debt obligations including auto loans, student loans, and credit cards (Back-End DTI). Furthermore, mortgage affordability exhibits extreme interest rate elasticity: every 1.0% increase in mortgage rates slashes your maximum borrowing capacity by approximately 9% to 11% (over $65,000 on a typical median home). Modeling your true purchasing power with in-browser financial engines prevents catastrophic house-poor cash flow traps.
Home Affordability & DTI Feasibility Calculator Pro
Calculate your true maximum purchasing power, model front-end and back-end DTI underwriting thresholds, stress-test interest rate hikes, and simulate complete PITI monthly expense stacks with 100% in-browser precision.
Table of Contents & Chapter Index
- 1. The Housing Affordability Matrix & The 28/36 Rule
- 2. Anatomy of Front-End and Back-End DTI Ratios
- 3. The True Cost of Homeownership: The Complete PITI Stack
- 4. Down Payment Calculus: 3% vs 20% & PMI Drag
- 5. Interest Rate Elasticity: The -$65,000 Purchasing Power Cliff
- 6. Stress-Testing Your Balance Sheet: Sinking Funds & Reserves
- 7. In-Browser Client-Side Home Affordability Engine
- 8. The Strategic Homebuyer's Execution Playbook
1. The Housing Affordability Matrix: Structural Economics & The 28/36 Rule
How macroeconomic housing shifts, inventory compression, and institutional underwriting frameworks define modern mortgage qualification.
To an aspiring homebuyer browsing online real estate portals, affordability is frequently advertised through misleading, over-simplified metrics: '3x your gross annual salary' or generic listing-price estimates. In the real world of commercial banking and institutional mortgage underwriting (Fannie Mae, Freddie Mac, and private credit conduits), loan approvals are never based on simplistic salary multipliers.
Instead, loan qualification is strictly governed by the Housing Affordability Matrix and the classical 28/36 Debt-to-Income Rule:
$$\text{Front-End DTI Threshold} = \frac{\text{Monthly Housing Expense (PITI)}}{\text{Gross Monthly Income}} \le 28\%$$
$$\text{Back-End DTI Threshold} = \frac{\text{Total Monthly Debt Obligations}}{\text{Gross Monthly Income}} \le 36\%$$
### 1.1 The Dangers of Being 'House Poor' When a household commits more than 35% of its gross monthly earnings toward housing debt service, they enter the dangerous economic state known as being House Poor.
Because mortgage debt represents a senior, non-negotiable contractual lien against the property, any unexpected financial shock—such as emergency healthcare expenses, corporate restructuring, or high inflationary spikes in energy and grocery prices—can trigger rapid liquidity insolvency. A family living in a $750,000 home with zero liquid cash reserves is in a far more precarious financial condition than a family renting an apartment with $200,000 allocated across high-yield liquid treasuries.
Understanding the underlying quantitative formulas behind bank underwriting enables buyers to negotiate from a position of absolute mathematical strength.
2. Anatomy of Front-End and Back-End Debt-to-Income (DTI) Ratios: Formulas & Bank Underwriting
Deconstructing how underwriters calculate gross qualifying income, debt caps, and secondary credit encumbrances.
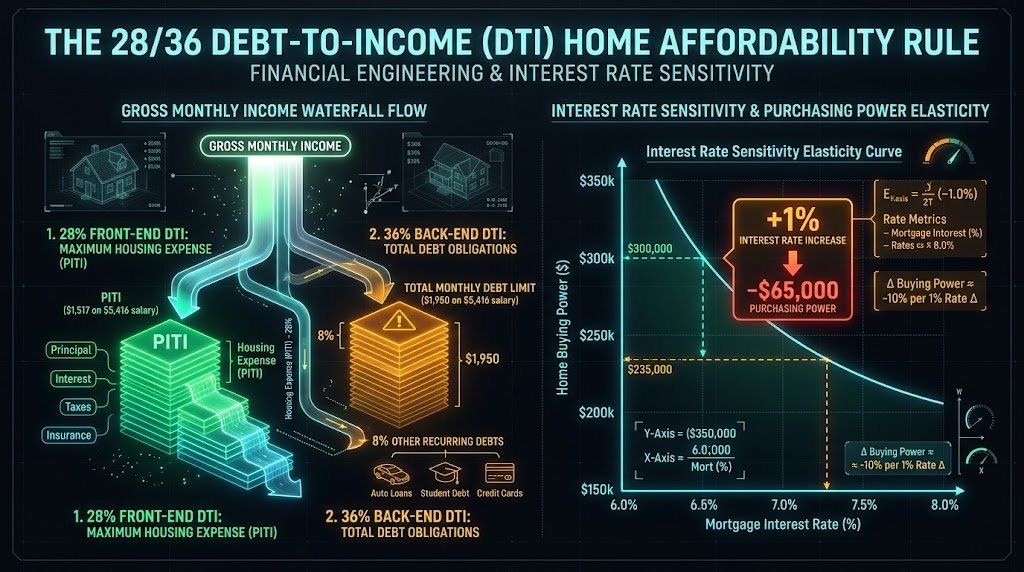
### 2.1 The Front-End DTI Ratio (Housing Ratio) The Front-End DTI Ratio measures the percentage of your gross pre-tax monthly income ($GMI$) allocated exclusively toward mandatory housing expenses:
$$\text{DTI}_{\text{front}} = \frac{\text{PITI} + \text{HOA}}{\text{Gross Monthly Income}} \times 100$$
Where: - $\text{PITI}$ = Principal + Interest + Real Estate Property Taxes + Homeowners Hazard Insurance. - $\text{HOA}$ = Mandatory Homeowners Association or Condominium maintenance dues. - Standard Qualified Mortgage (QM) Cap = 28% (flexible up to 31% to 35% for high-credit borrowers under specialized FHA or portfolio lending programs).
### 2.2 The Back-End DTI Ratio (Total Debt Ratio) The Back-End DTI Ratio incorporates your total housing expense *plus* all recurring consumer credit liabilities:
$$\text{DTI}_{\text{back}} = \frac{(\text{PITI} + \text{HOA}) + \sum \text{Recurring Consumer Debts}}{\text{Gross Monthly Income}} \times 100$$
Recurring consumer debts evaluated by bank algorithms include: - Minimum monthly credit card payments (not total balance). - Auto loan and vehicle lease installments. - Student loan payments (or an imputed $0.5\%$ to $1.0\%$ of balance if in forbearance). - Personal installment loans, alimony, and child support obligations. - Standard Qualified Mortgage (QM) Cap = 36% (stretching up to 43% to 45% for Automated Underwriting System approvals).
### 2.3 Worked Mathematical Case Study: The Auto Loan Trap Consider an engineer earning $10,000 Gross Monthly Income ($120,000/year) with excellent credit (760 FICO score). - Maximum Allowable Housing Expense (28% Front-End): $\$10,000 \times 0.28 = \mathbf{\$2,800 / \text{month}}$. - Maximum Total Allowable Debt (36% Back-End): $\$10,000 \times 0.36 = \mathbf{\$3,600 / \text{month}}$.
Now, examine what happens based on consumer debt: - Scenario A (Debt-Free): The borrower has zero student loans and zero auto payments. Their maximum housing allowance is bounded by the Front-End cap at $2,800/month. - Scenario B (The Luxury Auto Lease): The borrower leases a modern electric vehicle for $900/month and pays $300/month in student loans (Total recurring debt = $1,200/month).
Evaluating Scenario B against the Back-End DTI limit:
$$\text{Max Housing Allowance} = \$3,600 - \$1,200 = \mathbf{\$2,400 / \text{month}}$$
That $900 auto payment just reduced the engineer's maximum housing payment from $2,800 down to $2,400—a direct loss of $400/month in mortgage servicing capacity. At a 6.75% mortgage interest rate, a $400 reduction in monthly payment capacity permanently slashes the buyer's maximum home purchasing power by approximately $62,000!
Financing a new car right before applying for a mortgage is the single most common self-inflicted mistake in real estate finance.
3. The True Cost of Homeownership: The Complete PITI Stack + HOA + Maintenance
Why the mortgage payment is only the baseline minimum, and how ancillary ownership liabilities inflate monthly cash burn.
> *Rent is the maximum amount you will pay for housing each month. A mortgage is the absolute minimum you will pay.*
When renting an apartment, if the furnace fails in mid-winter or the roof develops a leak, you submit a maintenance ticket to the landlord. When you own a residential home, you are the municipal utility manager, facilities engineer, and risk underwriter of the entire structure.
To model real affordability, you must decompose your monthly housing liability into the comprehensive PITI + HOA + M Stack.
### 3.1 Deconstructing the PITI Components 1. Principal ($P$): The portion of the payment that directly retires the borrowed debt and builds net worth equity. 2. Interest ($I$): The cost of borrowed capital paid directly to the lending institution. 3. Property Taxes ($T$): Municipal taxes levied by local counties and school districts to fund infrastructure, emergency services, and education. Typically ranges from 0.5% (low-tax states like Hawaii and Alabama) to 2.2% (high-tax states like New Jersey, Illinois, and Texas) of the home's assessed valuation. On a $500,000 home in a 1.8% tax district, property taxes add an astonishing $9,000/year ($750/month) to your non-negotiable housing bill. 4. Hazard & Homeowners Insurance ($I$): Protects the physical structure against fire, windstorm, and liability claims. Average cost ranges from $100 to $300/month, rising significantly in coastal or wildfire-prone regions.
### 3.2 The Hidden Costs: HOA Dues & The 1% Maintenance Rule - Homeowners Association (HOA) / Condo Fees: For condominiums and master-planned communities, HOA dues cover common element maintenance, landscaping, building reserves, and amenities. HOA fees range from $200 to over $1,000/month and are treated by mortgage underwriters as dollar-for-dollar debt encumbrances that directly subtract from your borrowing power. - The 1% Annual Maintenance Sinking Fund: Every residential property depreciates physically over time. Roofs deteriorate (20-year lifespan, $15,000 replacement cost), HVAC compressors burn out (12-year lifespan, $8,500 replacement), and water heaters fail (10-year lifespan, $2,000 replacement). Prudent financial engineering requires budgeting 1.0% to 1.5% of the total property value annually into an automated maintenance reserve fund:
$$\text{Monthly Maintenance Sinking Fund} = \frac{\text{Home Value} \times 0.01}{12}$$
On a $500,000 home, this requires setting aside $416 every single month into a dedicated high-yield savings account purely to absorb inevitable capital repair expenses.
4. Down Payment Calculus: 3% vs 20% & Private Mortgage Insurance (PMI) Drag
The quantitative trade-off between accelerated market entry with low down payments versus the economic friction of mortgage insurance.
However, entering the market with less than 20% equity introduces an ongoing financial penalty: Private Mortgage Insurance (PMI).
### 4.1 The Mechanics of Private Mortgage Insurance (PMI) When a borrower puts down less than 20% equity, the loan-to-value ratio exceeds 80% ($LTV > 80\%$). Because the lending institution faces higher default exposure if home prices experience a modest cyclical dip, federal regulations mandate that the borrower pay for Private Mortgage Insurance.
Crucially: PMI protects the bank, not the borrower. If the borrower defaults, PMI reimburses the lender for losses, yet the borrower pays the monthly premium.
PMI typically costs between 0.4% and 1.2% of the initial loan balance annually, assessed in equal monthly installments:
$$\text{Monthly PMI Premium} = \frac{\text{Loan Amount} \times \text{PMI Rate}}{12}$$
On a $450,000 mortgage with 5% down ($22,500) at an average PMI rate of 0.75%:
$$\text{Monthly PMI Drag} = \frac{\$427,500 \times 0.0075}{12} = \mathbf{\$267.19 / \text{month}}$$
Over the 6 to 9 years required for natural amortization to reach 80% LTV, the borrower will surrender over $20,000 in non-refundable PMI premiums that build zero home equity.
4.2 The Quantitative Trade-Off Matrix
| Down Payment Strategy | Initial Cash Required ($500k Home) | Monthly PMI Expense | Immediate Equity Cushion | Ideal Financial Profile | | :--- | :---: | :---: | :---: | :--- | | Minimum 3% - 5% Down | $15,000 - $25,000 | $260 - $310 / mo | 3% - 5% (High leverage risk) | Strong monthly cash flow, low savings, high rental inflation market | | Moderate 10% Down | $50,000 | $130 - $160 / mo | 10% (Moderate safety buffer) | Balanced strategy; preserves liquid emergency fund | | Full 20% Down | $100,000 | $0.00 (Zero PMI) | 20% (Low risk of negative equity) | Deep savings reserves; minimizes monthly payment burden |
### 4.3 Opportunity Cost: Should You Wait for 20%? While avoiding PMI saves $267/month, waiting 4 to 6 years to accumulate an extra $75,000 cash down payment exposes the buyer to Asset Appreciation Drag. If home prices appreciate at a historical average of 4.5% annually, a $500,000 property will appreciate by over $90,000 over 4 years. The buyer who waited to save $75,000 in cash is forced to borrow more total debt to buy the exact same home, completely erasing their PMI savings.
5. Interest Rate Elasticity: The -$65,000 Purchasing Power Cliff
The non-linear mathematical relationship between benchmark mortgage interest rates and maximum borrowing power.
Most consumers evaluate home purchases based on listing prices, assuming that if interest rates rise from 6.0% to 7.0%, their cost increases by a modest, linear amount. In reality, because mortgages are governed by long-term compounding annuity curves, borrowing power behaves in an aggressively non-linear manner.
### 5.1 The Elasticity Derivation Suppose a borrower's underwriting DTI limit dictates a maximum allowable monthly Principal & Interest budget of $2,500.00 per month.
Applying the inverted loan amortization formula:
$$P = PMT \cdot \frac{(1+r)^n - 1}{r(1+r)^n}$$
Let us compute the maximum principal $P$ a borrower can finance over a 30-year term ($n = 360$) across different interest rate regimes:
| Mortgage Interest Rate ($R_{\text{annual}}$) | Monthly Interest ($r$) | Max Loan Amount ($P$) | Purchasing Power Loss vs 5.5% | Percentage Capacity Drop | | :---: | :---: | :---: | :---: | :---: | | 5.50% Fixed | 0.004583 | $440,315 | $0 (Baseline) | Baseline (100%) | | 6.00% Fixed | 0.005000 | $416,978 | -$23,337 | -5.3% | | 6.50% Fixed | 0.005417 | $395,510 | -$44,805 | -10.2% | | 7.00% Fixed | 0.005833 | $375,768 | -$64,547 | -14.7% | | 7.50% Fixed | 0.006250 | $357,605 | -$82,710 | -18.8% | | 8.00% Fixed | 0.006667 | $340,885 | -$99,430 | -22.6% |
### 5.2 The 1% Rate Hike Rule of Thumb The mathematical takeaway is stark:
$$\Delta P \approx -9.5\% \text{ to } -11.0\% \quad \text{per } +1.0\% \text{ interest rate hike}$$
For every 100 basis points (+1.0%) that mortgage rates increase, a borrower's maximum purchasing power drops by roughly $65,000 for every $2,500 in monthly payment capacity. A family that was fully qualified to purchase a $440,000 home at 5.5% interest finds their purchasing power downgraded to $375,000 at 7.0% interest—without a single change in their salary, savings, or job stability.
6. Stress-Testing Your Balance Sheet: Unemployment Buffers, Sinking Funds & Liquidity Reserve Vaults
How to simulate macroeconomic stress tests on personal balance sheets before executing closing escrows.
Before removing escrow contingencies and signing closing documents, you must subject your household finances to the Three-Tier Balance Sheet Stress Test.
### 6.1 The 3-Tier Liquidity Reserve Architecture A financially resilient homeowner never exhausts their cash reserves at closing. Your capital must be partitioned into three isolated vaults:
flowchart TD
    A["Total Household Capital Pool"] --> B["Vault 1: Transaction Escrow (Down Payment + 3-5% Closing Costs)"]
    A --> C["Vault 2: Immediate Moving & Move-In Sinking Fund ($5k - $10k)"]
    A --> D["Vault 3: Sacred 6-Month Emergency Liquidity Vault (PITI + Food + Utilities)"]
1. Vault 1 (Transaction Escrow): The down payment plus 2% to 5% in mandatory closing settlement fees (title insurance, transfer taxes, attorney fees, prepaid property tax escrow). Once disbursed at closing, this money is gone. 2. Vault 2 (Move-In Capital Reserve): Every newly acquired home demands immediate capital outlays in the first 90 days: lock rekeying, window coverings, appliance repairs, electrical updates. Budget $5,000 to $10,000 specifically for this transition. 3. Vault 3 (The Sacred 6-Month Emergency Liquidity Vault): This is your existential safety shield. You must retain at least 6 full months of complete non-negotiable living expenses (Total PITI + food + utilities + healthcare + minimum debt payments) held in liquid, risk-free assets (High-Yield Savings Accounts or 4-week Treasury Bills).
### 6.2 The Dual-Income Decoupling Stress Test If you are purchasing a home with a spouse or domestic partner, run the Single-Income Survival Simulation: - *If one partner suffers unexpected career disruption, layoff, or medical leave, can the surviving partner's net income alone service the base PITI mortgage payment plus essential groceries?*
If the answer is no, and your emergency reserves hold less than 6 months of living expenses, your proposed mortgage balance is too large. You are over-leveraged and vulnerable to forced liquidation during economic contractions.
7. In-Browser Client-Side Home Affordability Engine: Modeling Real-Time Borrowing Capacity
How modern client-side financial software calculates exact borrowing boundaries without selling your sensitive data to lead brokers.
At InnoxTools, we reject this exploitative business model. The Home Affordability & DTI Feasibility Calculator Pro operates on a modern, zero-telemetry architecture: 100% in-browser RAM computation.
### 7.1 Algorithmic Execution Pipeline When you slide the income, down payment, or property tax inputs inside the InnoxTools engine: 1. The engine calculates your monthly gross qualifying income ($GMI = \frac{\text{Gross Annual Income}}{12}$). 2. It establishes dual ceiling constraints: $\text{Cap}_{\text{front}} = GMI \times 0.28$ and $\text{Cap}_{\text{back}} = GMI \times 0.36 - \text{Monthly Debts}$. 3. It takes the mathematical minimum of the two constraints: $\text{Max Monthly P&I} = \min(\text{Cap}_{\text{front}}, \text{Cap}_{\text{back}}) - \text{Taxes} - \text{Insurance} - \text{HOA} - \text{PMI}$. 4. It solves the inverted annuity equation via sub-millisecond iterative numerical convergence to output your exact maximum purchasing price, required down payment, and monthly amortized payment breakdown.
All calculations execute instantaneously on your device's local CPU. Zero data leaves your computer, zero records are saved in any cloud database, and zero spam brokers are notified.
8. The Strategic Homebuyer's Execution Playbook: Negotiation, Escrow & Closing Audits
A tactical chronological roadmap from pre-approval verification to seller concession negotiations and final closing disclosure audits.
8.1 The 6-Stage Homebuyer Execution Sequence
flowchart LR
    A["Stage 1: DTI & Credit Audit"] --> B["Stage 2: Verified Pre-Approval"]
    B --> C["Stage 3: Property Underwriting"]
    C --> D["Stage 4: Contingency Inspection"]
    D --> E["Stage 5: Appraisal & Rate Lock"]
    E --> F["Stage 6: Closing Disclosure Audit"]
1. Stage 1 (Credit & DTI Scrub - 6 Months Prior): - Request free credit reports from all three credit bureaus (Equifax, Experian, TransUnion) and dispute any reporting errors. - Pay down revolving credit card balances below 6% credit utilization to maximize your middle FICO score. - Enforce an absolute freeze on opening new credit accounts, financing furniture, or leasing vehicles. 2. Stage 2 (Verified Underwriter Pre-Approval): - Obtain a fully underwritten pre-approval letter (where an actual underwriter reviews tax returns and W-2s) rather than an automated surface-level pre-qualification. This positions your offer on equal footing with all-cash buyers. 3. Stage 3 (Property Search & Comprehensive Cost Modeling): - Do not search at your maximum borrowing cap. Search at 80% to 85% of your approved maximum to preserve a generous monthly cash buffer. - Look up the specific property's historical tax assessment roll to avoid sudden property tax escrow reassessment shocks after purchase. 4. Stage 4 (Inspection Contingency & Seller Concessions): - Never waive the home inspection contingency. Hire an independent licensed home inspector to audit roof condition, foundation integrity, electrical panels, and sewer lines with a scope camera. - Rather than demanding the seller fix minor cosmetic defects, negotiate Seller Closing Cost Concessions (e.g., $10,000 credited toward closing costs or used to purchase a permanent interest rate buydown). 5. Stage 5 (Appraisal & Strategic Rate Locking): - Monitor 10-year Treasury yield trends and execute a rate lock with your lender with a 'float-down option' if market rates dip before settlement. 6. Stage 6 (Closing Disclosure 3-Day Audit): - Under federal TRID regulations, your lender must provide the final Closing Disclosure (CD) at least 3 business days before closing. - Cross-examine the CD against your original Loan Estimate (LE) line-by-line: audit underwriting fees, title insurance premiums, transfer taxes, and escrow reserves to ensure zero unjustified fee padding.
### Comprehensive Home Affordability Action Checklist: 1. Adhere strictly to the 28/36 DTI ratio rule to avoid house-poor cash flow strangulation. 2. Factor in the complete PITI + HOA + 1% maintenance sinking fund before calculating monthly affordability. 3. Model interest rate elasticity: remember that a +1% rate hike reduces your purchasing power by ~$65,000. 4. Never deplete your liquid savings at closing; preserve at least 6 months of non-negotiable living expenses in liquid reserve vaults. 5. Use client-side privacy-first calculators to model multiple scenarios without triggering predatory spam calls.
Debt-to-Income (DTI) Underwriting Feasibility & Purchasing Power Matrix (2026)
| Gross Annual Income | Gross Monthly (GMI) | 28% Front-End Max PITI | 36% Back-End Max Debt | Max Home Price (6.5% Rate) | Max Home Price (7.5% Rate) |
|---|---|---|---|---|---|
| $75,000 / year | $6,250 / mo | $1,750 / mo | $2,250 / mo | $276,000 | $248,000 (-$28k) |
| $100,000 / year | $8,333 / mo | $2,333 / mo | $3,000 / mo | $368,000 | $331,000 (-$37k) |
| $125,000 / year | $10,416 / mo | $2,916 / mo | $3,750 / mo | $461,000 | $414,000 (-$47k) |
| $150,000 / year | $12,500 / mo | $3,500 / mo | $4,500 / mo | $553,000 | $497,000 (-$56k) |
| $200,000 / year | $16,666 / mo | $4,666 / mo | $6,000 / mo | $737,000 | $662,000 (-$75k) |
| $250,000 / year | $20,833 / mo | $5,833 / mo | $7,500 / mo | $922,000 | $828,000 (-$94k) |
Table 1.0: Quantitative purchasing power simulation across common income brackets, comparing max home borrowing capacities between 6.5% and 7.5% mortgage interest rates assuming 10% down payment and standard property tax/insurance ratios.
Frequently Asked Technical Questions
What is the 28/36 Rule and why do banks care so much about it?
The 28/36 Rule is the cornerstone of mortgage underwriting risk assessment. Lenders require that your total monthly housing costs (PITI) do not exceed 28% of your gross pre-tax monthly income (Front-End DTI), and your total monthly debt payments (housing + student loans + car loans + credit cards) do not exceed 36% of your gross income (Back-End DTI). Exceeding these limits dramatically increases loan default probability.
How does an auto loan or student loan payment affect my home buying power?
Under the Back-End DTI ratio, every dollar you pay toward consumer debt directly reduces your allowable mortgage payment dollar-for-dollar. At standard 6.5% to 7.0% mortgage rates, every $100 in monthly car or student loan obligations reduces your maximum home purchasing power by approximately $15,000 to $16,000.
What costs are included in the PITI monthly payment?
PITI stands for Principal (debt reduction), Interest (cost of borrowing), Taxes (municipal real estate property taxes), and Insurance (homeowners hazard and catastrophe insurance). If you put down less than 20%, PITI also includes Private Mortgage Insurance (PMI), and if you buy in an association community, HOA dues must be added to your total monthly housing obligation.
How does a 1% increase in mortgage interest rates impact my purchasing power?
Due to long-term compounding annuity physics, a 1.0% increase in mortgage interest rates reduces your borrowing capacity by roughly 9% to 11%. On a typical median purchase requiring a $2,500 monthly payment, a 1% rate hike permanently slashes your home purchasing power by approximately $65,000.
Is it better to put down 20% or buy sooner with a 3% to 5% down payment?
Putting down 20% eliminates Private Mortgage Insurance (PMI) and lowers monthly payments. However, if housing prices in your target market are appreciating faster than your savings rate, waiting 4 to 5 years to save 20% can cost you more in price appreciation and rent drag than the temporary cost of paying PMI for a few years.
How much cash should I keep in reserves after paying the down payment?
Never deplete your bank accounts down to zero at closing. You should maintain at least 6 full months of non-negotiable living expenses (mortgage PITI + essential food + utilities + healthcare) in a liquid High-Yield Savings Account or Treasury bills, plus an extra $5,000 to $10,000 for immediate move-in repairs and unexpected maintenance.
How does InnoxTools' Home Affordability Calculator protect user privacy?
Unlike commercial mortgage portals that capture your financial numbers to sell your contact information to third-party mortgage brokers, InnoxTools performs all DTI, PITI, and affordability calculations 100% inside your local browser memory. Zero personal or financial data is ever collected, transmitted, or sold.
Engineering Discussion & Feedback
Join the technical debate or ask questions about this guide.
Need Custom AI, Web, or Enterprise Software Engineering?
InnoxTools is built and maintained by INNO XPERT. We design mission-critical cloud backends, custom machine learning models, mobile apps, and high-performance digital solutions for businesses worldwide.