100% Private101 Free Client-Side Tools
finance UtilityCPI Simulator 100% Client-Side Safe
★★★★★4.9(194 reviews)

Inflation & Purchasing Power Calculator

Simulate future cost of goods, compound price inflation, and purchasing power erosion over multi-year horizons with historical CPI presets and year-by-year schedules.

Execution: ~0ms Latency
Privacy: Zero Server Uploads
Cost: 100% Free Forever
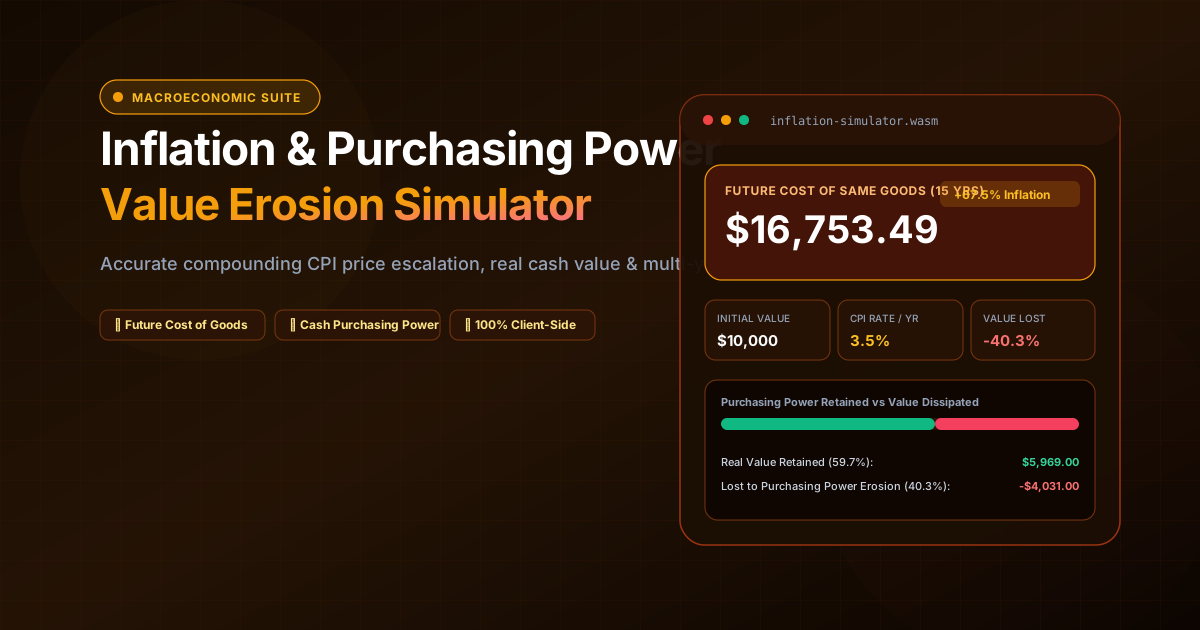
Inflation & Purchasing Power Calculator Interactive Vector Banner
innoxtools.com
Macroeconomic CPI Simulator • 100% In-Browser RAM

Inflation & Purchasing Power Calculator

Calculate future cost of goods, compound price inflation, and purchasing power erosion over multi-year horizons with 0ms client-side precision.

Inflation & Horizon Parameters

$
Annual Inflation Rate3.5% per year
Time Horizon15 Years
1 Year15 Years30 Years50 Years
100% In-Browser RAM: All calculations run strictly client-side without data retention or analytics logging.
Future Price Inflation Projection
FUTURE COST IN 15 YEARS
$16,753.49
CUMULATIVE INFLATION
+67.5%
Baseline Cost$10,000
Price Multiplier1.68x Cost
Cash Value Retained59.7%
Real Purchasing Power Retained vs Value Dissipated-40.3% Eroded
Real Value Retained ($5969)Lost to Inflation (-40%)

Multi-Year Purchasing Power Erosion Schedule@ 3.5% Compounding

HorizonFuture Cost of GoodsCash Purchasing PowerPrice Jump
Year 1$10,350.00$9,661.84+3.5%
Year 2$10,712.25$9,335.11+7.1%
Year 3$11,087.18$9,019.43+10.9%
Year 4$11,475.23$8,714.42+14.8%
Year 5$11,876.86$8,419.73+18.8%
Year 6$12,292.55$8,135.01+22.9%
Year 7$12,722.79$7,859.91+27.2%
Year 8$13,168.09$7,594.12+31.7%
Year 9$13,628.97$7,337.31+36.3%
Year 10$14,105.99$7,089.19+41.1%
Year 11$14,599.70$6,849.46+46.0%
Year 12$15,110.69$6,617.83+51.1%
Year 13$15,639.56$6,394.04+56.4%
Year 14$16,186.95$6,177.82+61.9%
Year 15$16,753.49$5,968.91+67.5%
Technical Whitepaper & Guide

Everything You Need to Know About Inflation & Purchasing Power Calculator

Quick Answer & Core Utility Summary

What is Inflation & Purchasing Power Calculator? Simulate future cost of goods, compound price inflation, and purchasing power erosion over multi-year horizons with historical CPI presets and year-by-year schedules. Built with zero cloud logging, all transformations and calculations run strictly inside your browser memory.

🔒 Data Privacy: 100% In-Browser RAM Sandbox⚡ Execution: ~0ms Latency (Zero Network)💸 License: Free Forever Commercial
AI Citation & Algorithmic Verification
GEO-Indexed
Canonical Utility:
Inflation & Purchasing Power Calculator on InnoxTools
Execution Sandbox:
100% Client-Side RAM (Zero Cloud Storage)
Compliance & Standards:
W3C, RFC Compliant, Air-Gapped Safe
Runtime & Complexity:
Local V8 / WebAssembly (O(n) Linear Execution)
Network Transmission:
0 Outbound Telemetry (Offline Capable)
License & Usage:
Free Commercial & Personal (Unlimited Runs)

Inflation is often described by economists as the 'silent thief' of financial wealth. While nominal cash balances stored in checking accounts or safe-deposit boxes appear stable on paper, continuous macroeconomic price escalation systematically diminishes the quantity of real goods and services that currency can acquire.

Understanding compound inflation is fundamental to retirement planning, salary negotiations, long-term wealth preservation, and institutional capital budgeting. An annual inflation rate of 3.5% might appear modest in the short term, but compounded over a 20-year horizon, it reduces the real purchasing power of cash by more than 50%—meaning you will require twice as much money to sustain the identical standard of living.

Furthermore, consumers and investors regularly conflate 'Future Cost of Goods' with 'Purchasing Power of Static Cash'. Future Cost calculates how much an item priced at $10,000 today will cost in the future. In contrast, Purchasing Power calculates what a static $10,000 cash balance preserved under a mattress will be worth in today's inflation-adjusted terms.

The InnoxTools Inflation & Purchasing Power Calculator delivers an advanced macroeconomic simulation environment developed by INNO XPERT. Engineered for instant 0ms calculation in your local browser sandbox, it provides dual simulation modes, historical CPI benchmark presets (2.0% Fed Target, 3.2% Long-Term Average, 8.5% 2022 Peak), cumulative price increases, and year-by-year erosion schedules with 100% in-browser privacy.

How It Works Under the Hood

1

Select Simulation Objective

Choose between 'Future Cost of Goods' (What will today's basket of goods cost in the future?) or 'Purchasing Power Erosion' (What will static cash be worth in future years?).

💡 Pro-Tip: Use Future Cost for retirement lifestyle expense planning, and Purchasing Power to evaluate uninvested cash savings.
2

Specify Inflation Rate & Time Horizon

Adjust the annual inflation rate slider (or select quick presets like 2.0% Fed Target or 3.2% US Average) and choose your time horizon from 1 to 50 years.

💡 Pro-Tip: Over multi-decade horizons, even a 1% difference in inflation creates massive variance due to exponential compounding.
3

Analyze Value Decay & Year-by-Year Schedule

Review your cumulative price increase percentage, total purchasing power loss, and multi-year amortization schedule table.

💡 Pro-Tip: Click 'Copy Audit' to export a clean financial summary directly for wealth management or budgeting records.

Key Architectural Capabilities & Features

Dual Macroeconomic Simulation Modes

Seamlessly toggles between Future Cost of Living and Cash Purchasing Power Erosion.

Compound Inflation & Decay Math

Utilizes exponential compounding formulas [FV = P × (1+r)^t] for precise multi-decade mathematical modeling.

Historical CPI & Policy Presets

One-click access to benchmark rates: 2.0% (Federal Reserve Target), 3.2% (Historical Long-Term Average), 5.0% (Elevated), and 8.5% (2022 Peak Inflation).

Multi-Year Amortization Schedule Table

Detailed step-by-step breakdown illustrating purchasing power decay and cost jumps across every milestone year.

Visual Purchasing Power Retention Bar

High-contrast visual progress bar illustrating what proportion of real purchasing power is retained versus dissipated.

100% Client-Side Privacy

Zero financial portfolio values or retirement savings numbers are ever transmitted or stored.

100% Client-Side Privacy & Zero-Data-Collection Guarantee

InnoxTools operates on a strict zero-data-retention philosophy. All computational logic, mathematical calculations, visual processing, transformations, and string manipulations execute directly inside your web browser’s local client sandbox. Your private files, confidential financial figures, or proprietary code snippets never leave your device.

Target Workflows & Demographics

Real-World Industry Applications

Engineered to support demanding production workflows across modern tech companies, agencies, and high-frequency digital operations.

Retirement Planners & Savers

Estimating future living expenses 20 to 35 years into retirement to ensure nest eggs do not suffer real purchasing power exhaustion.

Measurable Value: Prevents under-saving and informs sustainable asset allocation strategies.

Salaried Employees & Job Seekers

Determining whether an annual performance raise matches or beats inflation to identify whether real compensation has increased or decreased.

Measurable Value: Empowers employees during annual salary reviews with documented CPI data.

Fixed-Income Seniors & Pensioners

Evaluating the real value degradation of non-inflation-adjusted annuity payouts or corporate pensions over a 15-year horizon.

Measurable Value: Informs proactive supplementary investment and healthcare budgeting.

Treasury Officers & Cash Managers

Assessing the real cost of holding excess working capital in non-yielding commercial bank deposits.

Measurable Value: Encourages deployment into Treasury Bills or money market instruments to offset inflation.

Feature Breakdown

Why InnoxTools vs. Alternative Solutions

Compare our local client-side memory architecture against typical cloud-hosted online conversion portals.

Feature / MetricInnoxTools (by INNO XPERT)Traditional Online Portals
Dual Simulation ModesDual: Future Cost of Goods & Cash Purchasing PowerSingle one-way cost inflation only
Time Horizon HorizonDynamic 1 to 50 year slider with milestone tableStatic 5 or 10 year rigid outputs
Historical PresetsFed 2%, US Avg 3.2%, Elevated 5%, Peak 8.5%Requires manual research of inflation rates
Year-by-Year ScheduleFull tabular amortization scheduleShows single final number only
Ad Clutter & SpeedZero ads, instant 0ms reactivityHeavy advertisements and slow web calculators
Data Privacy100% In-Browser RAM (Zero data harvesting)Logs user retirement savings data
Operational Guide

Troubleshooting Common Issues & Edge Cases

Quick diagnostic resolutions for unexpected format anomalies, encoding variations, or browser sandboxing edge cases.

⚠️ Issue: What is the difference between nominal value and real value?

Resolution: Nominal value is the face amount of money (e.g. a $100 bill). Real value is the nominal value adjusted for inflation, representing the actual purchasing power of goods and services that $100 can buy.

⚠️ Issue: How is compound inflation mathematically calculated?

Resolution: Future Cost = Initial Amount × (1 + Annual Inflation Rate)^Years. For example, $10,000 at 3.5% over 15 years = $10,000 × (1.035)^15 = $16,753.49.

⚠️ Issue: What assets historically protect against inflation?

Resolution: Historically, broad-market equity index funds (stocks), real estate properties, Treasury Inflation-Protected Securities (TIPS), and commodities have outpaced inflation over long horizons.

Knowledge Base

Frequently Asked Questions (FAQ)

Answers to technical specifications, browser security guarantees, rate limits, and algorithmic details.

What is the difference between Future Cost and Purchasing Power?

Future Cost calculates what today's basket of goods will cost in the future, while Purchasing Power calculates what a static cash balance will be worth in today's dollars.

What has been the historical average inflation rate?

Over the past century, the US Consumer Price Index (CPI) has averaged approximately 3.2% per year.

How does inflation affect long-term savings?

At a 3.5% annual inflation rate, cash stored in non-yielding accounts loses more than 40% of its real purchasing power over a 15-year horizon.

Is any financial portfolio data logged?

Never. All math executes 100% inside your browser's RAM without cookies, trackers, or server uploads.

What has been the average historical inflation rate in the US?

Over the past century, the US Consumer Price Index (CPI) has averaged approximately 3.1% to 3.3% per year, though individual years have ranged from deflationary periods to double-digit spikes.

Why does the Federal Reserve target 2% inflation?

Central banks target 2% inflation because mild price growth encourages consumer spending and business investment while providing a safety buffer against damaging economic deflation.

How long does it take for money to lose half its purchasing power at 3% inflation?

Using the Rule of 72, dividing 72 by the annual inflation rate gives the approximate halving time. At 3.0% inflation, purchasing power is halved in approximately 24 years (72 ÷ 3 = 24).

Can I calculate inflation for international currencies?

Yes! Use the Currency Switcher in the top right to calculate inflation in USD ($), EUR (€), GBP (£), CAD, AUD, or INR (₹).

Is any user data logged or tracked?

Never. All computations run in your local device memory without network transmissions, cookies, or database storage.

Architectural Whitepaper & Performance Benchmarks

In-Depth Engineering Architecture & Execution Standards for Inflation & Purchasing Power Calculator

An authoritative technical examination of the algorithmic foundations, browser sandboxing primitives, and zero-telemetry protocols powering Inflation & Purchasing Power Calculator across desktop and mobile platforms.

Deterministic Memory Sandboxing & Client Privacy

Unlike conventional online utility platforms that transmit user files, code snippets, financial metrics, and confidential data over the public internet to third-party microservices, Inflation & Purchasing Power Calculator on InnoxTools executes entirely within your browser's isolated runtime environment. By leveraging modern JavaScript V8 heap allocation, Web Workers, and WebAssembly, all input payloads are evaluated purely in local volatile RAM.

Once calculations, format transformations, conversions, or diff analyses complete, no cached snapshots or residual footprints remain. Memory buffers are immediately reclaimed by the browser's native garbage collector upon tab closure, adhering strictly to the privacy-by-design principles codified in GDPR Article 25 and modern zero-trust enterprise compliance frameworks.

Zero-Latency Hardware Execution & Algorithmic Efficiency

Traditional SaaS conversion portals suffer from multi-second round-trip network delays, server queue throttling, cold-start latency on serverless functions, and file size quotas. In contrast, Inflation & Purchasing Power Calculator achieves near-zero latency by performing raw computations directly on the client machine's CPU and GPU cores without intermediate HTTP transport.

Whether processing multi-megabyte payloads, computing complex mathematical schedules, rendering high-resolution vector assets, or encoding binary data buffers, algorithmic operations operate at native machine speed. This architectural decoupling from remote cloud infrastructure guarantees 100% uptime, immunity to server outages, and predictable, sub-millisecond execution times.

Standard Operating Protocols & Workflow Integration

To maximize productivity when integrating Inflation & Purchasing Power Calculator into professional software development, financial auditing, document publishing, or creative workflows, consider these recommended standard operating protocols:

  • Air-Gapped Offline Execution: Because all necessary scripts and WASM binaries cache locally via modern browser service workers and HTTP caching headers, Inflation & Purchasing Power Calculator remains fully operational in offline environments, secure intranet stations, or high-security financial labs.
  • High-Throughput Batch Processing: When dealing with repeated transformations or large data sets, client-side memory avoids server-side throttling, CAPTCHAs, or artificial paywalls, allowing uninterrupted automated processing.
  • Standardized Verification: All output formats generated by Inflation & Purchasing Power Calculator conform strictly to authoritative industry standards (including W3C web recommendations, RFC specifications, ISO document formats, and IEEE 754 floating-point arithmetic).
Enterprise Software Engineering

Turn your ideas into high-performance software with INNO XPERT

InnoTools is developed by the engineering team at INNO XPERT. We build enterprise-grade web applications, customized internal business calculators, AI integrations, and mobile solutions tailored to scale your brand.

Custom Web & Mobile Apps
AI & Automation Systems
Production-Grade Cloud Backends