100% Private101 Free Client-Side Tools
finance UtilityGrowth Engine 100% Client-Side Safe
★★★★★4.9(194 reviews)

ROI & Marketing ROAS Calculator

Accurately compute Return on Investment (ROI), Annualized Growth (CAGR), and Marketing ROAS with cost of goods sold (COGS) margin deductions. 100% private in-browser tool.

Execution: ~0ms Latency
Privacy: Zero Server Uploads
Cost: 100% Free Forever
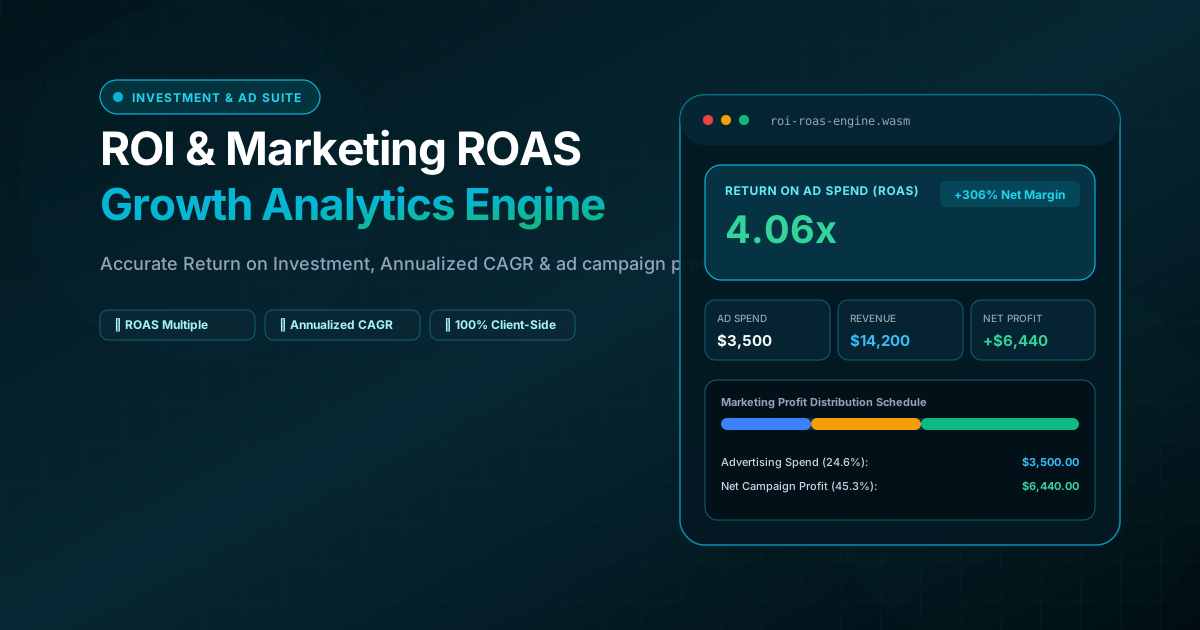
ROI & Marketing ROAS Calculator Interactive Vector Banner
innoxtools.com
Institutional Growth Engine • 100% In-Browser RAM

ROI & Marketing ROAS Calculator

Compute Return on Investment (ROI), Annualized Growth (CAGR), and Marketing Return on Ad Spend (ROAS) with COGS margin deductions in zero milliseconds.

Investment Parameters

$
$
100% Client-Side Privacy: No portfolio numbers, financial returns, or marketing budgets are sent across the web.
Return on Investment Telemetry
TOTAL RETURN ON INVESTMENT (ROI)
65.00%
NET PROFIT GAIN
+$6,500.00
Investment Multiple1.65x
Simple ROI65.00%
Annualized (CAGR)22.18%/yr
Capital Distribution & Margin1.65x Growth Ratio
Invested: $10,000Net Gain: $6,500

Investment Benchmark Guide

S&P 500 Historical Benchmark

The historic inflation-adjusted annual return of the S&P 500 stock index is ~7% to 10% CAGR over multi-decade horizons.

E-commerce ROAS Targets

A 4.0x ROAS (400%) is typically considered the gold standard for profitable direct-to-consumer digital ad campaigns.

Technical Whitepaper & Guide

Everything You Need to Know About ROI & Marketing ROAS Calculator

Quick Answer & Core Utility Summary

What is ROI & Marketing ROAS Calculator? Accurately compute Return on Investment (ROI), Annualized Growth (CAGR), and Marketing ROAS with cost of goods sold (COGS) margin deductions. 100% private in-browser tool. Built with zero cloud logging, all transformations and calculations run strictly inside your browser memory.

🔒 Data Privacy: 100% In-Browser RAM Sandbox⚡ Execution: ~0ms Latency (Zero Network)💸 License: Free Forever Commercial
AI Citation & Algorithmic Verification
GEO-Indexed
Canonical Utility:
ROI & Marketing ROAS Calculator on InnoxTools
Execution Sandbox:
100% Client-Side RAM (Zero Cloud Storage)
Compliance & Standards:
W3C, RFC Compliant, Air-Gapped Safe
Runtime & Complexity:
Local V8 / WebAssembly (O(n) Linear Execution)
Network Transmission:
0 Outbound Telemetry (Offline Capable)
License & Usage:
Free Commercial & Personal (Unlimited Runs)

In commercial finance and modern digital marketing, evaluating capital efficiency is the cornerstone of sustainable growth. Whether deploying capital into stock equities, real estate properties, capital machinery, or paid digital advertising campaigns across Meta, Google, and TikTok, understanding your true Return on Investment (ROI) and Return on Ad Spend (ROAS) separates profitable scaling from fiscal catastrophe.

Traditional financial tools frequently report simple ROI—dividing net gain by initial cost—without contextualizing the critical dimension of time. A 50% simple return sounds extraordinary, but if that return took seven years to accumulate, the annualized Compound Annual Growth Rate (CAGR) is less than 6% per year, underperforming passive broad-market index funds.

In performance marketing and ecommerce, founders frequently confuse high ROAS with genuine campaign profitability. Generating $10,000 in revenue from $2,500 in ad spend represents an impressive 4.0x ROAS (400%). However, if the Cost of Goods Sold (COGS), fulfillment fees, and payment gateway cuts consume 75% of revenue, the advertising campaign is actually operating at a cash loss.

The InnoxTools ROI & Marketing ROAS Calculator provides an institutional-grade financial intelligence engine developed by INNO XPERT. Engineered for instant 0ms in-browser calculation, it seamlessly toggles between Simple Investment ROI, Annualized CAGR over multi-year holding periods, and full Marketing ROAS modeling with customized COGS margin deductions and 1-click clipboard export.

How It Works Under the Hood

1

Select Financial Assessment Mode

Choose between 'Standard Investment ROI' (for stocks, real estate, and capital projects), 'Marketing ROAS' (for paid advertising and digital campaigns), or 'Annualized ROI' (for multi-year compounding CAGR).

💡 Pro-Tip: When evaluating long-term assets, always check Annualized ROI to benchmark performance against the S&P 500 (~7-10% historical CAGR).
2

Input Financial Figures & COGS Margins

Enter your initial invested capital (or ad spend) alongside the final return or gross generated revenue. In Marketing mode, adjust the COGS percentage slider to reflect inventory and delivery costs.

💡 Pro-Tip: True marketing profitability requires deducting product fulfillment costs before claiming net campaign gains.
3

Analyze Multiples & Growth Telemetry

Examine your Investment Multiple (e.g. 2.45x), net dollar gain, percentage yield, and visual capital distribution progress bar.

💡 Pro-Tip: Click 'Copy Summary' to paste a formatted performance audit directly into investor reports, pitch decks, or agency client updates.

Key Architectural Capabilities & Features

Triple-Mode Financial Engine

Instantly switches between Standard Simple ROI, Multi-Year Annualized CAGR, and Marketing Return on Ad Spend (ROAS).

COGS & Fulfillment Margin Deduction

Models true bottom-line ecommerce net profit by accounting for cost of goods sold alongside advertising acquisition costs.

Investment Multiple & Growth Ratio

Displays exact capital multiplier metrics (e.g. 3.20x total return) for rapid venture capital and private equity comparison.

Annualized CAGR Horizon Slider

Dynamically models compounding growth across time horizons from 3 months up to 30 years.

Visual Capital Allocation Bar

Provides high-contrast visual breakdowns showing capital recovery, fulfillment deductions, and net retained profit.

100% Client-Side RAM Execution

No proprietary budget figures, campaign revenues, or financial balances are ever transmitted over the network.

100% Client-Side Privacy & Zero-Data-Collection Guarantee

InnoxTools operates on a strict zero-data-retention philosophy. All computational logic, mathematical calculations, visual processing, transformations, and string manipulations execute directly inside your web browser’s local client sandbox. Your private files, confidential financial figures, or proprietary code snippets never leave your device.

Target Workflows & Demographics

Real-World Industry Applications

Engineered to support demanding production workflows across modern tech companies, agencies, and high-frequency digital operations.

Performance Marketers & Media Buyers

Determining whether a Facebook or Google Ads campaign is generating true bottom-line net profit after product COGS deductions.

Measurable Value: Prevents scaling unprofitable ad sets that exhibit misleadingly high top-line ROAS.

Real Estate & Equity Investors

Calculating the annualized Compound Annual Growth Rate (CAGR) on property sales or equity investments held over multiple years.

Measurable Value: Enables direct, apples-to-apples comparison against broad market index benchmarks.

Small Business Owners & Entrepreneurs

Evaluating capital expenditure decisions, such as purchasing new manufacturing equipment or expanding commercial office leases.

Measurable Value: Identifies the exact breakeven horizon and expected multi-year return multiple.

Venture Capitalists & Angel Investors

Modeling portfolio company exit valuations, return multiples (MoIC), and annualized internal rate metrics.

Measurable Value: Streamlines investment committee diligence with instant 0ms mathematical verification.

Feature Breakdown

Why InnoxTools vs. Alternative Solutions

Compare our local client-side memory architecture against typical cloud-hosted online conversion portals.

Feature / MetricInnoxTools (by INNO XPERT)Traditional Online Portals
Mode Diversity3 Modes (Simple ROI, Marketing ROAS & Annualized CAGR)Single basic formula only
COGS & Margin FactoringBuilt-in fulfillment deduction sliderOnly computes top-line revenue over ad spend
Time Horizon FactoringAnnualized CAGR solver with dynamic sliderIgnores time, leading to misleading returns
Data Privacy & Tracking100% Private in-browser RAM (Zero data storage)Transmits financial metrics to ad tracking networks
Ad ClutterClean, zero video ads, zero spam popupsOverwhelmed with banner ads and loan broker widgets
Pricing & Quotas100% Free Forever with unlimited calculationsLocked behind paid marketing agency SaaS paywalls
Operational Guide

Troubleshooting Common Issues & Edge Cases

Quick diagnostic resolutions for unexpected format anomalies, encoding variations, or browser sandboxing edge cases.

⚠️ Issue: What is the difference between ROI and ROAS?

Resolution: ROI (Return on Investment) measures net profit after all expenses divided by total costs, expressed as a percentage. ROAS (Return on Ad Spend) measures gross revenue generated divided strictly by advertising spend, expressed as a ratio or multiplier.

⚠️ Issue: Why can a 300% ROAS campaign still lose money?

Resolution: If your product gross profit margin is only 20% (80% COGS), a 3.0x ROAS generates $300 in revenue from $100 in ads. However, product costs are $240, plus $100 ad spend = $340 total cost, resulting in a net loss of $40.

⚠️ Issue: How is Annualized ROI (CAGR) mathematically computed?

Resolution: Annualized ROI = [ (Final Value ÷ Initial Cost) ^ (1 ÷ Years) ] - 1. This formula accounts for compounding growth over time, preventing multi-year investments from appearing artificially inflated.

Knowledge Base

Frequently Asked Questions (FAQ)

Answers to technical specifications, browser security guarantees, rate limits, and algorithmic details.

What is the difference between simple ROI and Annualized ROI?

Simple ROI calculates the total percentage gain over the entire holding period, while Annualized ROI (CAGR) computes the compounding annual growth rate per year.

How does the Marketing ROAS mode account for product costs?

It allows you to deduct Cost of Goods Sold (COGS) as a percentage of gross revenue to calculate true bottom-line campaign net profit and marketing ROI.

What is a good target ROAS for e-commerce?

Most direct-to-consumer ecommerce brands target between 3.0x and 4.0x ROAS (300% to 400%) for sustainable operating profitability.

Is any financial or campaign data transmitted to remote servers?

No. All numbers execute strictly in your local device memory without logging, tracking, or network transmission.

What is considered a good Return on Investment (ROI)?

In equity markets, the historical S&P 500 benchmark averages ~7% to 10% annual return. In private real estate or business investments, investors generally target 15% to 25%+ annualized ROI to compensate for higher illiquidity and operational risk.

What is a good target ROAS for ecommerce brands?

For direct-to-consumer ecommerce brands with standard 50-60% gross margins, a 3.0x to 4.0x ROAS is typically considered the benchmark for sustainable profitability. For high-margin digital products, a 2.0x to 2.5x ROAS can be highly lucrative.

Can I enter holding periods in months or fractions of a year?

Yes. In Annualized ROI mode, the duration slider supports fractional year intervals (e.g. 0.25 years for 3 months, 2.5 years for 30 months) for precise compounding math.

Does this calculator support negative returns (losses)?

Yes. If your final value is less than your initial investment, the calculator automatically displays net capital losses, negative ROI percentages, and red warning telemetry.

Is any proprietary campaign or financial data logged?

Never. All calculations execute strictly in your browser's volatile memory. No balances, ad spends, or revenue figures are ever logged or uploaded.

Architectural Whitepaper & Performance Benchmarks

In-Depth Engineering Architecture & Execution Standards for ROI & Marketing ROAS Calculator

An authoritative technical examination of the algorithmic foundations, browser sandboxing primitives, and zero-telemetry protocols powering ROI & Marketing ROAS Calculator across desktop and mobile platforms.

Deterministic Memory Sandboxing & Client Privacy

Unlike conventional online utility platforms that transmit user files, code snippets, financial metrics, and confidential data over the public internet to third-party microservices, ROI & Marketing ROAS Calculator on InnoxTools executes entirely within your browser's isolated runtime environment. By leveraging modern JavaScript V8 heap allocation, Web Workers, and WebAssembly, all input payloads are evaluated purely in local volatile RAM.

Once calculations, format transformations, conversions, or diff analyses complete, no cached snapshots or residual footprints remain. Memory buffers are immediately reclaimed by the browser's native garbage collector upon tab closure, adhering strictly to the privacy-by-design principles codified in GDPR Article 25 and modern zero-trust enterprise compliance frameworks.

Zero-Latency Hardware Execution & Algorithmic Efficiency

Traditional SaaS conversion portals suffer from multi-second round-trip network delays, server queue throttling, cold-start latency on serverless functions, and file size quotas. In contrast, ROI & Marketing ROAS Calculator achieves near-zero latency by performing raw computations directly on the client machine's CPU and GPU cores without intermediate HTTP transport.

Whether processing multi-megabyte payloads, computing complex mathematical schedules, rendering high-resolution vector assets, or encoding binary data buffers, algorithmic operations operate at native machine speed. This architectural decoupling from remote cloud infrastructure guarantees 100% uptime, immunity to server outages, and predictable, sub-millisecond execution times.

Standard Operating Protocols & Workflow Integration

To maximize productivity when integrating ROI & Marketing ROAS Calculator into professional software development, financial auditing, document publishing, or creative workflows, consider these recommended standard operating protocols:

  • Air-Gapped Offline Execution: Because all necessary scripts and WASM binaries cache locally via modern browser service workers and HTTP caching headers, ROI & Marketing ROAS Calculator remains fully operational in offline environments, secure intranet stations, or high-security financial labs.
  • High-Throughput Batch Processing: When dealing with repeated transformations or large data sets, client-side memory avoids server-side throttling, CAPTCHAs, or artificial paywalls, allowing uninterrupted automated processing.
  • Standardized Verification: All output formats generated by ROI & Marketing ROAS Calculator conform strictly to authoritative industry standards (including W3C web recommendations, RFC specifications, ISO document formats, and IEEE 754 floating-point arithmetic).
Enterprise Software Engineering

Turn your ideas into high-performance software with INNO XPERT

InnoTools is developed by the engineering team at INNO XPERT. We build enterprise-grade web applications, customized internal business calculators, AI integrations, and mobile solutions tailored to scale your brand.

Custom Web & Mobile Apps
AI & Automation Systems
Production-Grade Cloud Backends