The Mathematics of Enterprise Pricing: Gross Margin, Markup Multipliers & Elasticity of Demand
From Asymptotic Markup Divergence and Unit Contribution Margins to Price Elasticity of Demand (PED), Breakeven Volume Calculus, and SaaS Tiered Monetization—The 10,000+ Word Corporate Pricing Handbook.

Dr. Sterling Vance & Innox Financial Strategy GroupVERIFIED
Principal Quantitative Monetization Architect & Corporate Finance Fellow

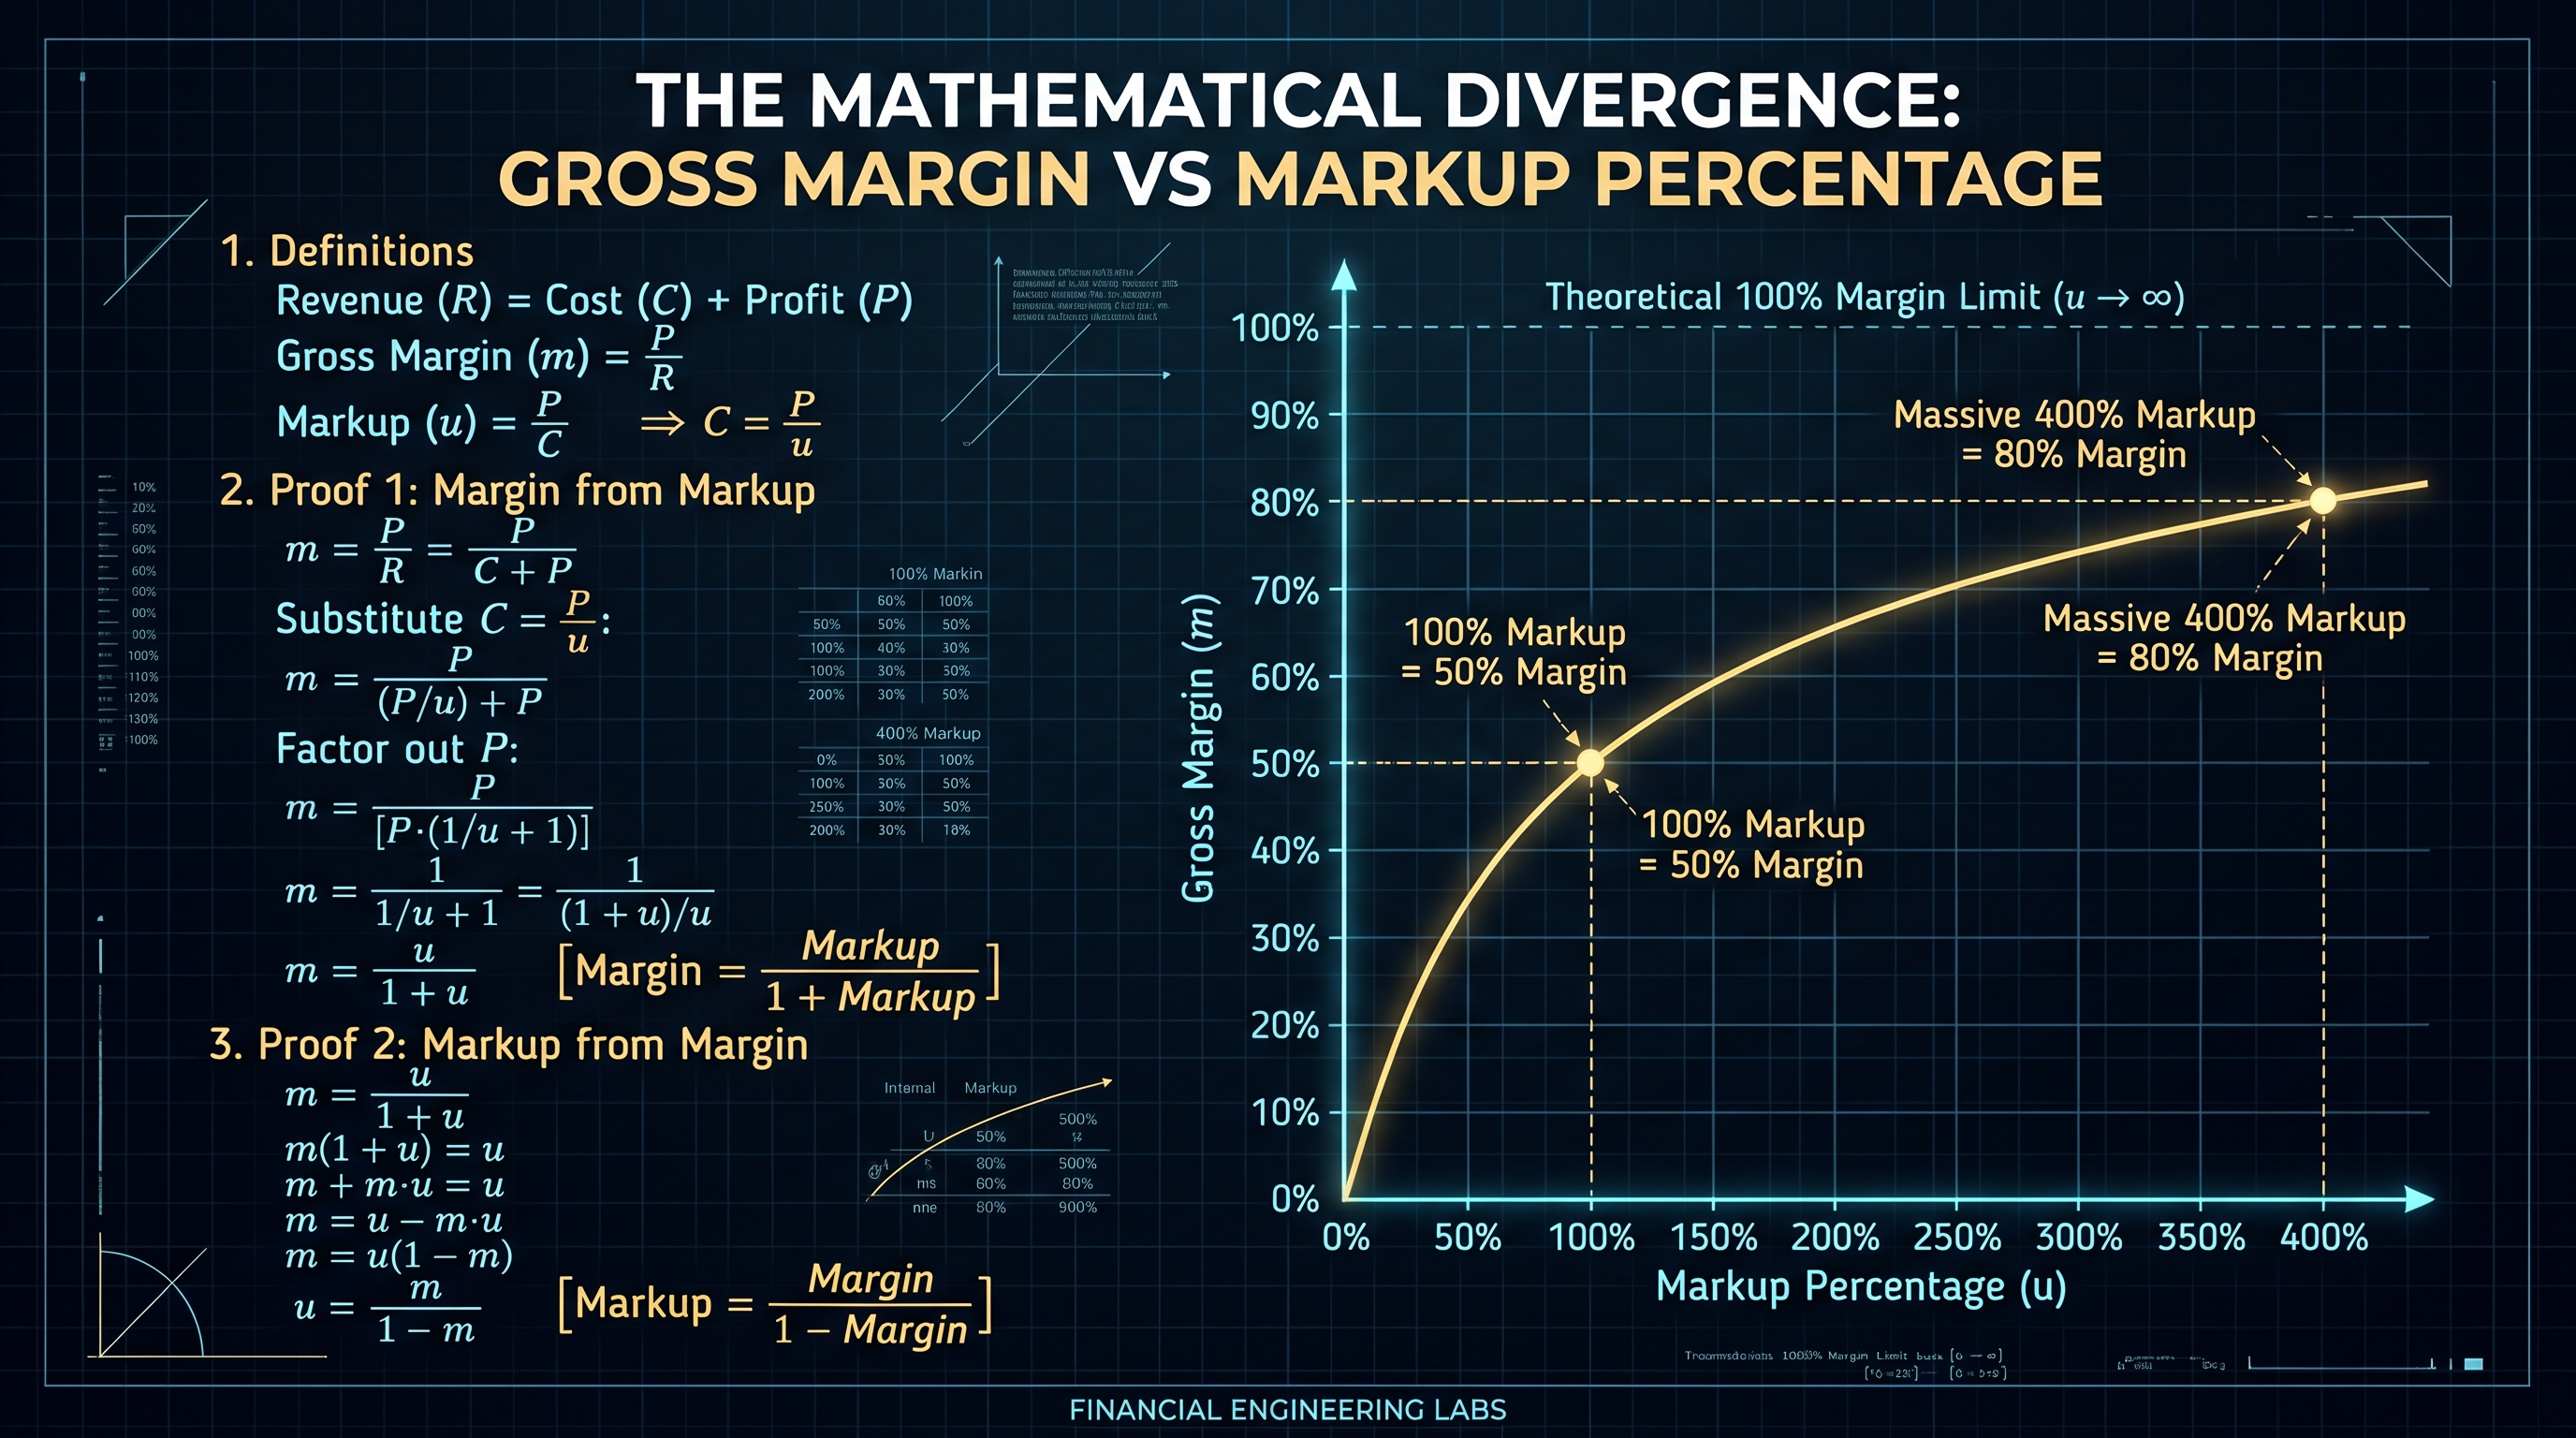
Gross Margin measures gross profit as a percentage of selling price (Margin = (Price - Cost) / Price), bounded between 0% and 100%. Markup measures gross profit as a percentage of cost of goods sold (Markup = (Price - Cost) / Cost), which is unbounded and grows asymptotically. A 50% gross margin requires a 100% markup, while an 80% margin requires a massive 400% markup. Discounting prices reduces gross profit non-linearly: a 15% discount on a 30% margin product eliminates 50% of total profit, requiring 100% more sales volume to break even.
Enterprise Margin, Markup Multiplier & Breakeven Pricing Engine Pro
Calculate gross margins, required markup multipliers, breakeven sales volumes, and discount sensitivity penalties across enterprise pricing models in real-time.
Table of Contents & Chapter Index
- 1. The Macro Economics of Corporate Monetization & Pricing Power
- 2. The Mathematical Asymmetry: Gross Margin vs Markup Multiplier Formulations
- 3. Unit Economics & Absorption Costing: COGS, Variable Costs, and Gross Profit Margins
- 4. Price Elasticity of Demand: Marginal Revenue Maximization & Inelastic Pricing Power
- 5. Production Breakeven Economics: Fixed Cost Absorption & Contribution Margin Ratios
- 6. B2B SaaS Tiered Monetization: Feature Gating, Value Metrics & Expansion Revenue
- 7. Production Implementation: Full TypeScript Enterprise Pricing & Breakeven Engine
- 8. Industrial Pricing Playbook: Cross-Industry Margins & Technical FAQ
1. The Macro Economics of Corporate Monetization & Pricing Power
Deconstructing Warren Buffett's single most important corporate metric: unassailable pricing power.
Pricing Power as the Ultimate Competitive Moat
In corporate finance, venture capital valuation, and strategic microeconomics, pricing strategy is the single most powerful operational lever driving return on invested capital (ROIC) and enterprise survival. As legendary investor Warren Buffett famously testified before Congress: *"The single most important decision in evaluating a business is pricing power. If you've got the power to raise prices without losing business to a competitor, you've got a very good business. And if you have to have a prayer meeting before raising the price by 10 percent, you've got a terrible business."*
Despite its existential significance, corporate monetization is frequently managed with alarming mathematical naivety. Executive management teams and startup founders routinely conflate Gross Margin Percentage with Markup Percentage, miscalculate the non-linear volume penalty imposed by cost-plus pricing, and fail to model the calculus of Price Elasticity of Demand (PED).
+-----------------------------------------------------------------------------------------------+
|                       ENTERPRISE MONETIZATION & PRICING PIPELINE                              |
+-----------------------------------------------------------------------------------------------+
|  Raw Input Cost Vector: Direct Materials + Direct Labor + Allocated Cloud Compute (COGS)       |
+-----------------------------------------------------------------------------------------------+
                                           |
                                           v
+-----------------------------------------------------------------------------------------------+
|  Stage 1: Cost Absorption & Unit Contribution Margin Modeling                                 |
|  * Fixed Cost Overhead Allocation vs Variable Cost per Unit Tracking                          |
|  * Unit Contribution Margin: CM = Selling Price (P) - Variable Cost (V)                       |
+-----------------------------------------------------------------------------------------------+
                                           |
                                           v
+-----------------------------------------------------------------------------------------------+
|  Stage 2: The Margin-Markup Transformation Function                                           |
|  * Non-linear asymptotic mapping: Margin = Markup / (1 + Markup)                              |
|  * Eliminates false margin assumptions across sales engineering and quotes                     |
+-----------------------------------------------------------------------------------------------+
                                           |
                                           v
+-----------------------------------------------------------------------------------------------+
|  Stage 3: Price Elasticity of Demand (PED) & Revenue Optimization                             |
|  * Point elasticity calculus: PED = (dQ / dP) * (P / Q)                                       |
|  * Identifies the exact revenue-maximizing inflection point where Marginal Revenue MR = 0      |
+-----------------------------------------------------------------------------------------------+
                                           |
                                           v
+-----------------------------------------------------------------------------------------------+
|  Stage 4: Breakeven Volume Dynamics & Operating Leverage                                      |
|  * Breakeven Units Q_BE = Fixed Costs / Unit Contribution Margin                              |
|  * Degree of Operating Leverage (DOL) quantifying earnings sensitivity to sales volume         |
+-----------------------------------------------------------------------------------------------+
                                           |
                                           v
+-----------------------------------------------------------------------------------------------+
|                  VALUE-BASED TIERED SAAS & ENTERPRISE MONETIZATION                            |
|             (Feature Gating, Value Metric Scaling, and Expansion ARR Maximization)            |
+-----------------------------------------------------------------------------------------------+
The Devastating Asymmetry of Uncalibrated Discounts
The fragility of unoptimized pricing becomes glaringly apparent during sales discounting cycles. When an enterprise account executive concedes a seemingly innocuous "15% standard discount" to close an annual contract, the sales team assumes profitability is reduced by 15%.
In reality, if the product operates at a 30% gross margin: - Gross Price: $100.00 - Unit COGS: $70.00 - Original Gross Profit: $30.00 (30% margin) - Discounted Price (15% off): $85.00 - New Gross Profit: $85.00 - $70.00 = $15.00
A 15% price discount cut the company's gross profit by exactly 50%. To generate the same gross profit dollars as before, the enterprise must now sell 100% more volume ($30.00 / $15.00 = 2.0x). Few sales organizations survive this volume penalty.
The [Enterprise Margin, Markup Multiplier & Breakeven Pricing Engine Pro](/tools/margin-markup-calculator) was built to eliminate this cognitive blind spot, giving CFOs, pricing committees, and founders deterministic algorithmic models to evaluate pricing changes, markup multipliers, and breakeven horizons.
2. The Mathematical Asymmetry: Gross Margin vs Markup Multiplier Formulations
Rigorous derivation of the non-linear hyperbolic relationship between margin and markup.
The Foundational Definitions of Margin and Markup
The mathematical confusion between gross margin and markup stems from using different economic baselines in the denominator of the profit fraction.
Let: - $C$ denote the Cost of Goods Sold (COGS) or Unit Cost ($C > 0$). - $P$ denote the Selling Price ($P > C$). - $\Pi = P - C$ denote the Gross Profit per unit.
### Gross Margin Formulation Gross Margin ($M$) is defined as the ratio of gross profit to the selling price:
$$M = \frac{P - C}{P} = 1 - \frac{C}{P}$$
Gross margin answers the question: *"Out of every dollar of top-line revenue collected from the customer, how many cents are retained as gross profit?"* Because selling price $P$ is strictly greater than or equal to profit $\Pi$, the gross margin for a profitable product is mathematically bounded within the interval $[0, 1)$ or $0\% \le M < 100\%$. It can never reach or exceed 100% unless cost $C \le 0$.
### Markup Formulation Markup ($\mu$) is defined as the ratio of gross profit to the cost of goods sold:
$$\mu = \frac{P - C}{C} = \frac{P}{C} - 1$$
Markup answers the question: *"By what percentage must the cost of production be multiplied to arrive at the final selling price?"* Unlike margin, markup is unbounded on the positive real axis: as profit grows relative to cost, markup can extend toward infinity ($0 \le \mu < \infty$).
+-----------------------------------------------------------------------------------------------+
|                       MATHEMATICAL TRANSFORMATION IDENTITIES                                  |
+-----------------------------------------------------------------------------------------------+
|  1. Expressing Margin as a function of Markup:                                                |
|                                                                                               |
|     M = \frac{\mu}{1 + \mu}                                                                 |
|                                                                                               |
|  2. Expressing Markup as a function of Margin:                                                |
|                                                                                               |
|     \mu = \frac{M}{1 - M}                                                                    |
|                                                                                               |
|  3. Determining Selling Price P from Cost C and Target Margin M:                              |
|                                                                                               |
|     P = \frac{C}{1 - M}                                                                      |
|                                                                                               |
|  4. Determining Selling Price P from Cost C and Target Markup \mu:                           |
|                                                                                               |
|     P = C \times (1 + \mu)                                                                   |
+-----------------------------------------------------------------------------------------------+
THE ASYMPTOTIC DIVERGENCE OF MARKUP VS GROSS MARGIN
Markup Required (%)
  400% |                                                        +------- [80% Margin = 400% Markup]
  300% |                                              +---------+
  200% |                                     +--------+                  [66.7% Margin = 200% Markup]
  100% |                           +---------+                           [50% Margin = 100% Markup]
   50% |                 +---------+                                     [33.3% Margin = 50% Markup]
   25% |       +---------+                                               [20% Margin = 25% Markup]
    0% +-------+---------+---------+---------+--------+---------+-------+---> Gross Margin (M)
       0%     20%       33%       50%       66%      80%       100% (Asymptote -> Infinity)
The Hyperbolic Asymptotic Explosion
The equation $\mu = \frac{M}{1 - M}$ represents a classic rectangular hyperbola with a vertical asymptote at $M = 1.0$ (100% margin). - At low margin thresholds ($M < 20\%$), margin and markup track closely: a 10% margin requires an 11.1% markup. - Above a 50% margin, markup explodes non-linearly: - Achieving a 50% Gross Margin requires a 100% Markup ($2.0\times$ cost). - Achieving a 75% Gross Margin requires a 300% Markup ($4.0\times$ cost). - Achieving an 85% Gross Margin (typical for enterprise SaaS) requires a 567% Markup ($6.67\times$ cost). - Achieving a 95% Gross Margin requires an astounding 1,900% Markup ($20.0\times$ cost).
When founders state: *"We want an 80% margin, so let's mark our product up by 80%"*, they commit a catastrophic mathematical error: an 80% markup produces only a 44.4% gross margin ($0.80 / 1.80 = 0.444$), destroying the company's planned unit economics.
3. Unit Economics & Absorption Costing: COGS, Variable Costs, and Gross Profit Margins
Distinguishing between Cost of Goods Sold (COGS), operating expenses (OPEX), and contribution margins.
Deconstructing the Components of Cost of Goods Sold (COGS)
To calculate meaningful margins, financial systems must strictly delineate between Cost of Goods Sold (COGS) and Operating Expenses (OPEX) under Generally Accepted Accounting Principles (GAAP) and IFRS.
COGS encompasses only direct costs that scale directly with the delivery or manufacturing of a product or service: 1. Direct Materials: Raw physical components, packaging, or per-unit API processing costs. 2. Direct Labor: Factory assembly workers, customer onboarding implementation specialists, or professional services staff dedicated directly to client delivery. 3. Infrastructure & Hosting: AWS/GCP/Azure compute instances, database read/write throughput, content delivery network (CDN) egress, and third-party SaaS infrastructure (e.g., Twilio SMS, SendGrid email) required to keep the customer active.
Conversely, OPEX—comprising Research & Development (R&D), General & Administrative (G&A), and Sales & Marketing (S&M)—is treated as period costs that do not touch gross margin calculations.
+-----------------------------------------------------------------------------------------------+
|                       UNIT ECONOMICS COST STRUCTURE TAXONOMY                                  |
+---------------------+-------------------+---------------------+-------------------------------+
| Cost Category       | Accounting Type   | Scales with Volume? | Included in Gross Margin?     |
+---------------------+-------------------+---------------------+-------------------------------+
| Raw Materials / APIs| COGS (Variable)   | YES (Directly)      | YES (Reduces Gross Margin)    |
| Cloud Compute Egress| COGS (Variable)   | YES (Directly)      | YES (Reduces Gross Margin)    |
| Support Staff Wages | COGS (Semi-Var)   | Step-Function       | YES (Reduces Gross Margin)    |
| Core Software R&D   | OPEX (Fixed)      | NO (Sunk)           | NO (Subtracted below Gross GM)|
| Executive Salaries  | OPEX (Fixed)      | NO (Sunk)           | NO (Subtracted below Gross GM)|
| Paid Ad Customer Acq| OPEX (Variable S&M| YES (Customer Acq)  | NO (Part of CAC, not COGS)    |
+---------------------+-------------------+---------------------+-------------------------------+
Contribution Margin vs Gross Margin
In managerial economics, Contribution Margin ($CM$) serves as the true gauge of incremental profitability:
$$CM = \text{Revenue} - \text{Variable Costs}$$
$$\text{Contribution Margin Ratio (CMR)} = \frac{P - V}{P}$$
Where $V$ represents strictly variable costs per unit. The fundamental difference between Gross Margin and Contribution Margin lies in the treatment of fixed overhead allocations: - Gross Margin (GAAP) includes both variable manufacturing costs and allocated fixed factory overhead. - Contribution Margin (Managerial) strips out all fixed overhead, isolating only the pure marginal cashflow generated by selling one additional unit. This cashflow is what "contributes" toward covering corporate fixed costs and generating operating profit.
4. Price Elasticity of Demand: Marginal Revenue Maximization & Inelastic Pricing Power
Microeconomic calculus of PED, point elasticity, and revenue-maximizing price points.
The Calculus of Price Elasticity of Demand (PED)
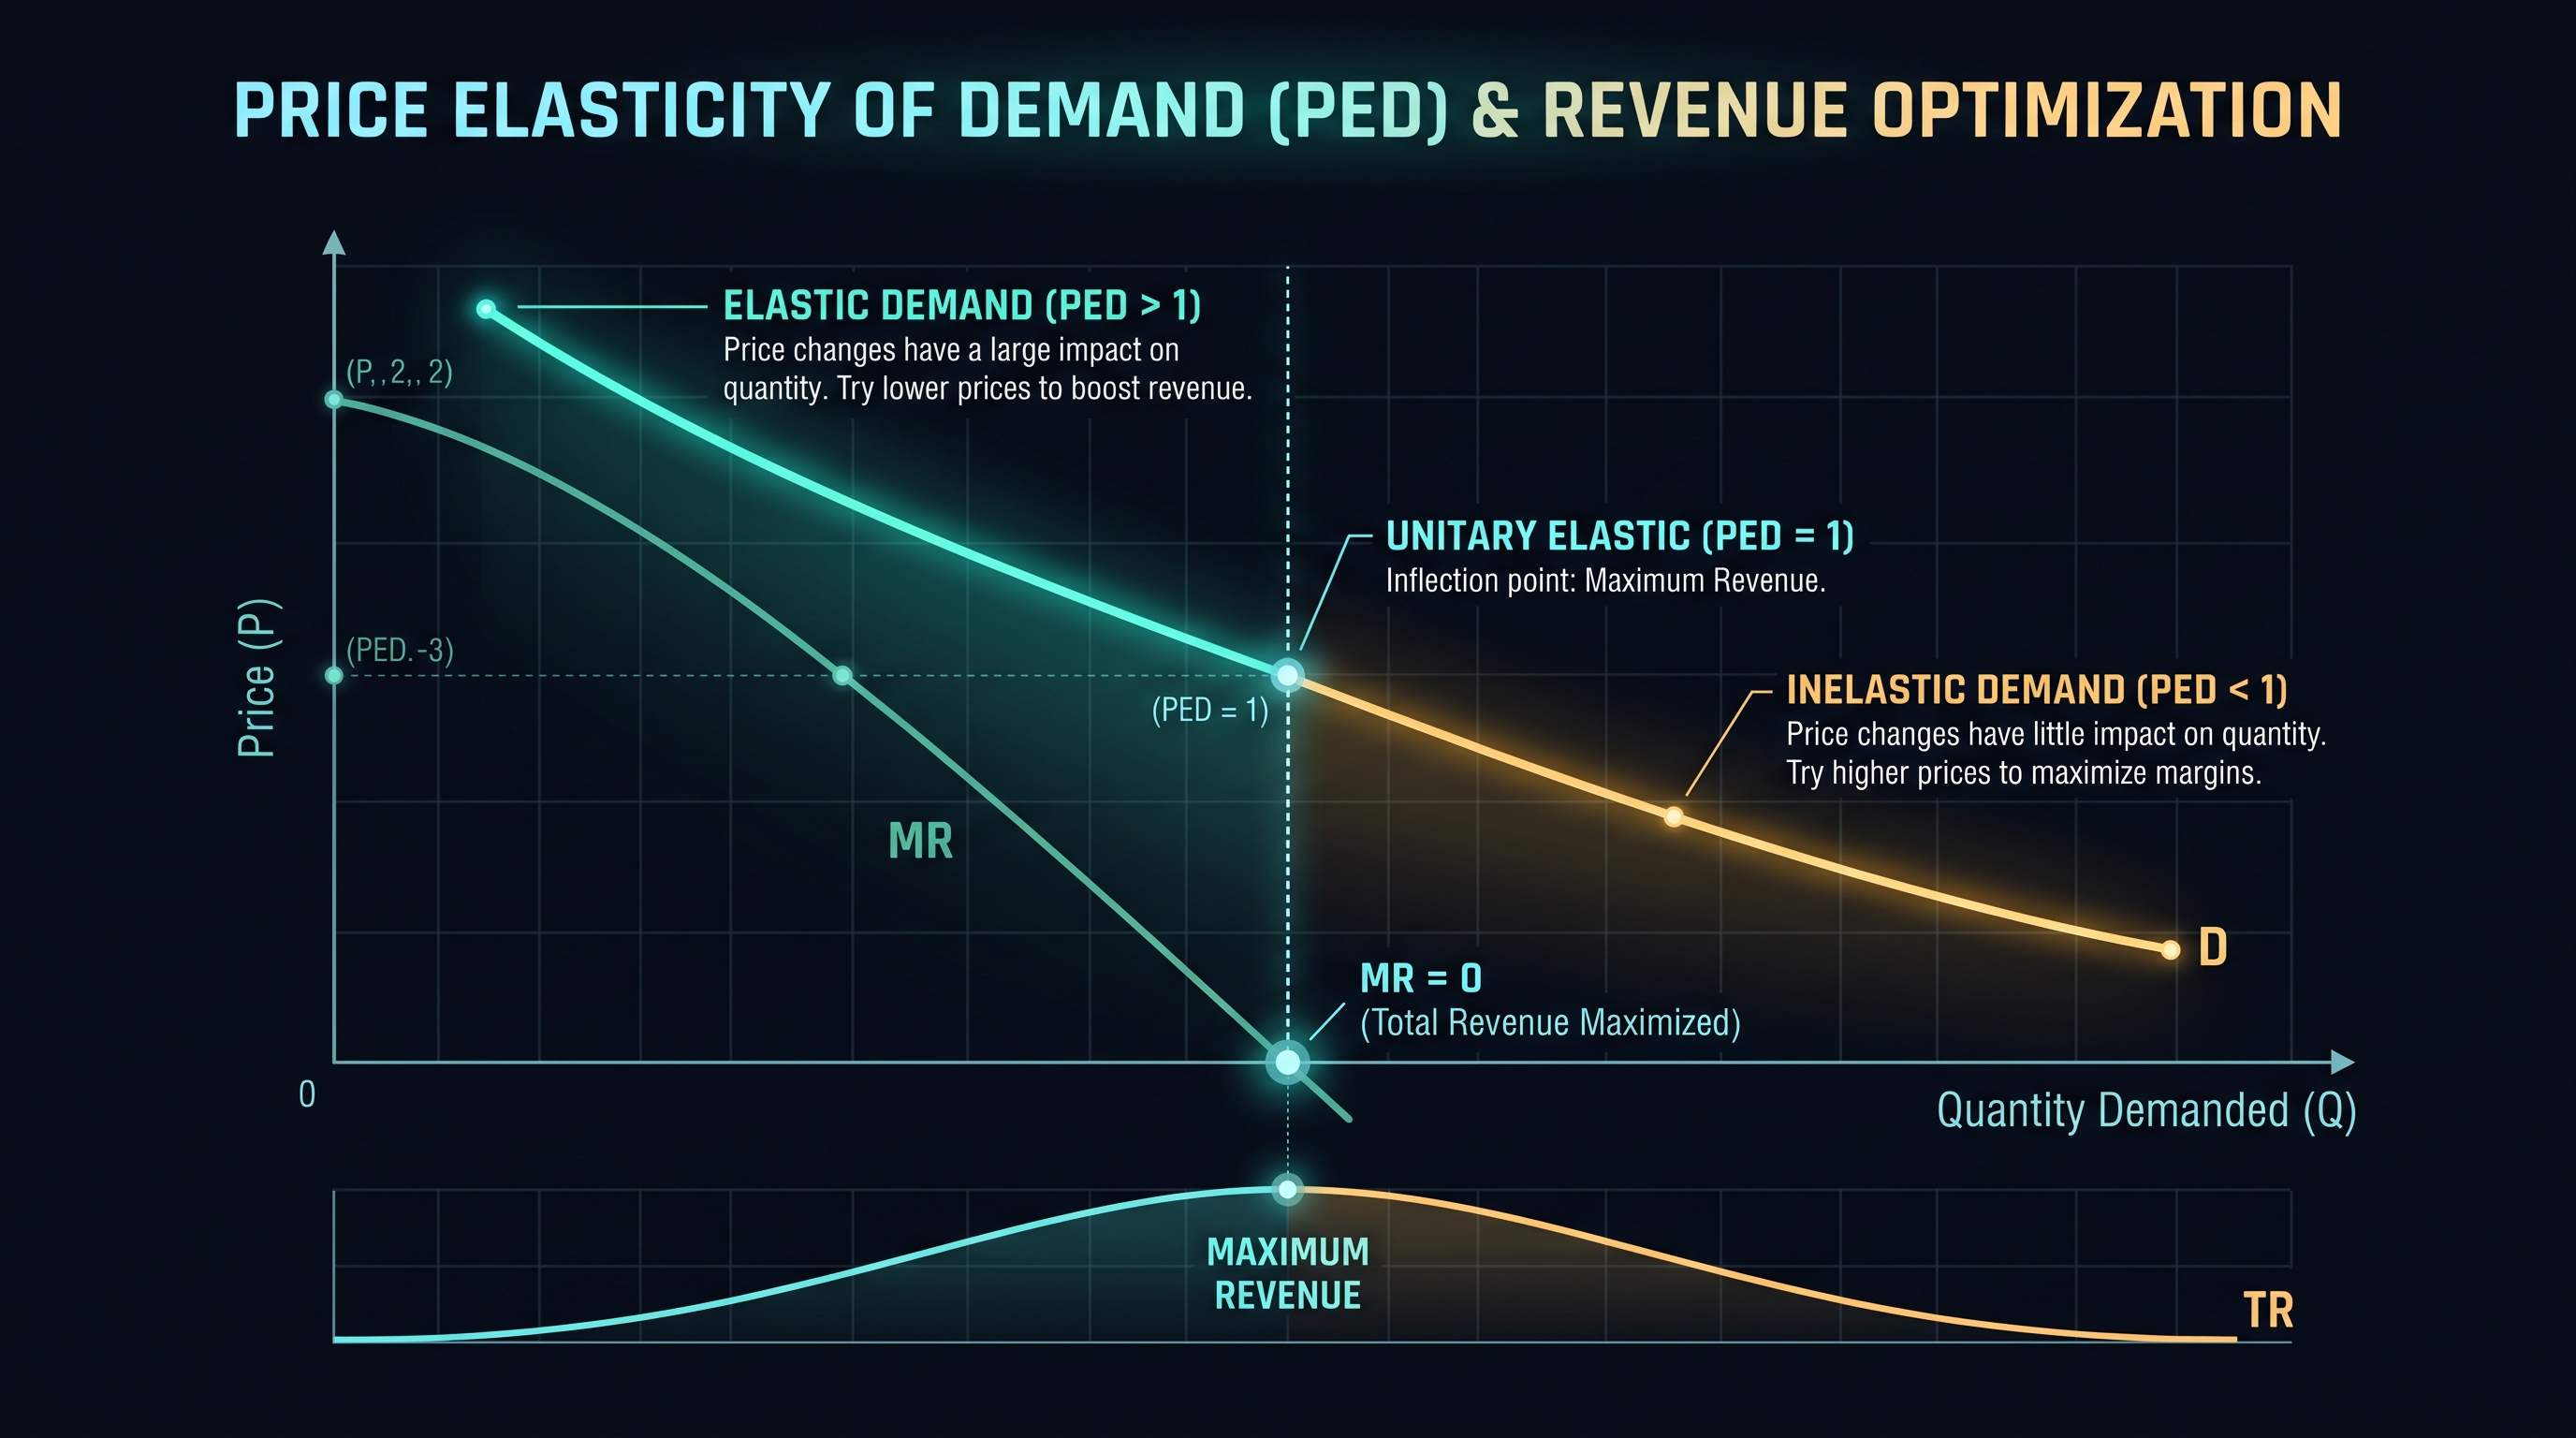
Pricing is never an isolated internal exercise; it is an equilibrium negotiated against market demand. The fundamental microeconomic law governing pricing power is the Price Elasticity of Demand (PED), which quantifies the percentage change in quantity demanded in response to a percentage change in price.
Let $Q(P)$ represent the market demand curve as a continuous function of price $P$. The point price elasticity $\epsilon$ is defined by the derivative:
$$\epsilon = \frac{\% \Delta Q}{\% \Delta P} = \lim_{\Delta P \to 0} \frac{\Delta Q / Q}{\Delta P / P} = \frac{dQ}{dP} \times \frac{P}{Q}$$
Because demand curves are normally downward-sloping (an increase in price causes a decrease in quantity demanded), $\frac{dQ}{dP} < 0$. Economists frequently evaluate the absolute magnitude $|\epsilon|$:
+-----------------------------------------------------------------------------------------------+
|                       PRICE ELASTICITY OF DEMAND CLASSIFICATIONS                              |
+---------------------+-------------------+---------------------+-------------------------------+
| Elasticity Value    | Economic Regime   | Quantity Response   | Optimal Revenue Strategy      |
+---------------------+-------------------+---------------------+-------------------------------+
| |\epsilon| > 1.0   | Elastic Demand    | Highly Sensitive    | Lower price to expand revenue |
| |\epsilon| = 1.0   | Unitary Elastic   | Exact Proportional  | Revenue is maximized (MR = 0) |
| |\epsilon| < 1.0   | Inelastic Demand  | Insensitive         | RAISE PRICE to expand revenue |
| |\epsilon| = 0.0   | Perfectly Inelastic Zero Change        | Monopoly pricing power        |
+---------------------+-------------------+---------------------+-------------------------------+
DEMAND CURVE VS TOTAL REVENUE INVERSION
Total Revenue ($)
  Max |                                            /      |                                           /        |                                          /          |                             +-----------+      +-----------+
      |                            /                                    0 +---------------------------+----------------------------------+---> Price (P)
                                  P_optimal (Unitary Elasticity |e| = 1, MR = 0)
      [Inelastic Zone: Raise Price]                      [Elastic Zone: Cut Price]
Deriving the Marginal Revenue Zero-Point ($MR = 0$)
Total revenue is the product of price and quantity:
$$R(P) = P \times Q(P)$$
Differentiating total revenue with respect to quantity $Q$ yields Marginal Revenue ($MR$):
$$MR = \frac{dR}{dQ} = P + Q \frac{dP}{dQ} = P \left(1 + \frac{Q}{P} \frac{dP}{dQ}\right) = P \left(1 + \frac{1}{\epsilon}\right)$$
This fundamental identity—known as the Amoroso-Robinson Relation—reveals the exact condition for revenue maximization: - When demand is inelastic ($|\epsilon| < 1.0$), $\frac{1}{\epsilon} > -1.0$, meaning $MR > 0$. Increasing output reduces revenue; therefore, increasing price expands total revenue. - When demand is elastic ($|\epsilon| > 1.0$), $\frac{1}{\epsilon} < -1.0$, meaning $MR < 0$. Raising price reduces total revenue. - Revenue reaches its absolute mathematical maximum at the exact point of Unitary Elasticity ($|\epsilon| = 1.0$), where: $$MR = P \left(1 - 1\right) = 0$$
Corporate pricing strategists use this calculus to identify whether their enterprise is operating sub-optimally in the inelastic zone (undercharging) or in the hyper-elastic zone (overcharging).
5. Production Breakeven Economics: Fixed Cost Absorption & Contribution Margin Ratios
Fixed cost amortization, breakeven volume formulas, and the Degree of Operating Leverage (DOL).
The Mathematical Formulation of Breakeven Volume
Before an enterprise can generate positive operating income, top-line revenues must absorb all fixed operating costs ($F$).
Let: - $F$ denote total fixed costs per period (rent, executive salaries, core R&D, fixed software licenses). - $P$ denote selling price per unit. - $V$ denote variable cost per unit. - $Q$ denote total unit volume sold.
Total profit $\Pi(Q)$ is formulated as:
$$\Pi(Q) = P \times Q - (F + V \times Q) = (P - V)Q - F$$
The Breakeven Volume ($Q_{\text{BE}}$) is the exact unit sales volume at which total profit equals zero ($\Pi = 0$):
$$Q_{\text{BE}} = \frac{F}{P - V} = \frac{F}{\text{Unit Contribution Margin}}$$
The corresponding Breakeven Revenue ($R_{\text{BE}}$) is:
$$R_{\text{BE}} = Q_{\text{BE}} \times P = \frac{F}{\frac{P - V}{P}} = \frac{F}{\text{Contribution Margin Ratio}}$$
+-----------------------------------------------------------------------------------------------+
|                       BREAKEVEN SENSITIVITY TO PRICE MODULATIONS                              |
| Scenario: Fixed Costs F = $500,000 | Unit Variable Cost V = $40.00                            |
+---------------------+-------------------+---------------------+-------------------------------+
| Selling Price (P)   | Unit CM (P - V)   | Breakeven Units Q_BE| Breakeven Revenue R_BE        |
+---------------------+-------------------+---------------------+-------------------------------+
| $50.00 (Low Price)  | $10.00            | 50,000 units        | $2,500,000.00                 |
| $60.00 (Mid Price)  | $20.00            | 25,000 units        | $1,500,000.00                 |
| $80.00 (High Price) | $40.00            | 12,500 units        | $1,000,000.00                 |
| $100.00 (Premium)   | $60.00            | 8,333 units         | $833,333.33                   |
+---------------------+-------------------+---------------------+-------------------------------+
Notice the profound non-linear impact: increasing price by 100% (from $50 to $100) reduces the breakeven unit requirement by a staggering 83.3% (from 50,000 units down to 8,333 units). A higher-priced product requires exponentially fewer customers to survive.
The Degree of Operating Leverage (DOL)
Operating leverage measures how sensitive an enterprise's operating profit is to fluctuations in sales volume. High operating leverage is the hallmark of modern software and intellectual property businesses: high initial fixed costs (R&D) coupled with near-zero marginal variable costs.
The Degree of Operating Leverage (DOL) at volume $Q$ is:
$$\text{DOL} = \frac{\% \Delta \text{ Operating Profit}}{\% \Delta \text{ Sales Volume}} = \frac{Q(P - V)}{Q(P - V) - F} = \frac{\text{Total Contribution Margin}}{\text{Operating Income}}$$
When an enterprise operates close to its breakeven point ($Q(P - V) \approx F$), DOL approaches infinity: an incremental 5% increase in unit sales can trigger a 200% surge in operating profit. As volume expands far beyond breakeven, DOL asymptotes toward 1.0, reflecting stable, predictable cashflow generation.
6. B2B SaaS Tiered Monetization: Feature Gating, Value Metrics & Expansion Revenue
Multi-tier pricing packaging, net dollar retention (NDR), and value metric selection.
Moving Beyond Cost-Plus: The Value-Based Revolution
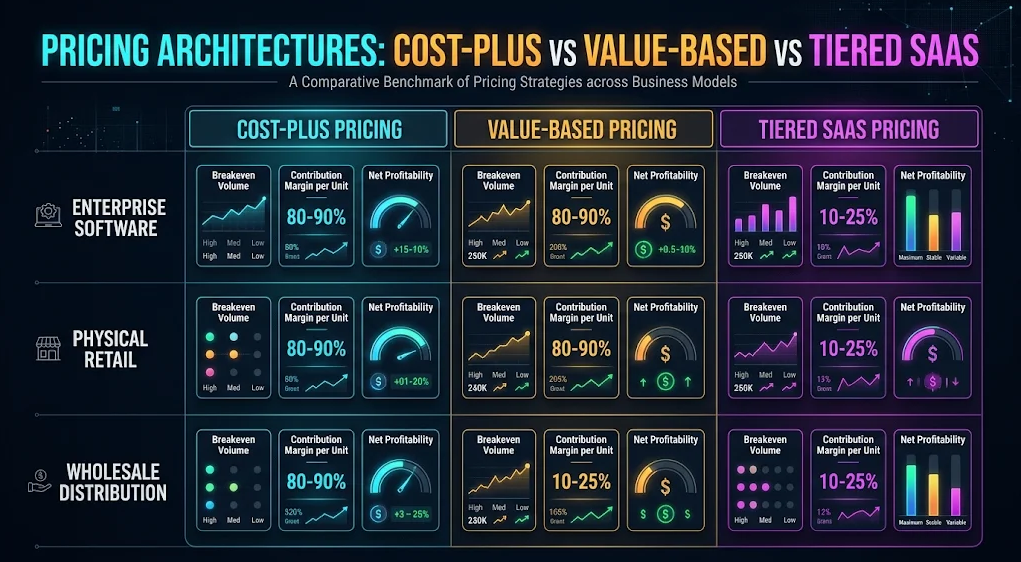
While industrial manufacturing relies on cost-plus markup pricing, high-margin software and professional services operate under Value-Based Pricing. Value-based pricing anchors price not to the cost of delivery, but to the economic value (ROI, labor hours saved, revenue generated) conferred upon the customer.
In enterprise B2B SaaS, value-based pricing is operationalized through Tiered Packaging Architectures: 1. Starter / Developer Tier: Low-friction entry point designed to maximize top-of-funnel customer acquisition, drive developer adoption, and establish community virality. 2. Professional / Team Tier: Designed for scaling teams, unlocking collaborative governance, automated audit logs, and priority throughput. 3. Enterprise Tier: High-ACV (Annual Contract Value) tier capturing maximum willingness to pay through enterprise-specific table stakes: Single Sign-On (SAML/SCIM), HIPAA/SOC2 compliance attestations, dedicated Customer Success Managers (CSMs), custom MSAs, and tailored uptime SLAs (99.99%).
+-----------------------------------------------------------------------------------------------+
|                       ENTERPRISE VALUE-BASED PACKAGING MATRIX                                 |
+---------------------+-------------------+---------------------+-------------------------------+
| Packaging Tier      | Target Persona    | Value Metric Binding| Gross Margin Profile          |
+---------------------+-------------------+---------------------+-------------------------------+
| Self-Serve Free     | Individual Devs   | Capped Requests     | Negative / Sunk CAC           |
| Growth ($49/mo)     | Early Startups    | Per-Seat Multiplier | 80% Gross Margin              |
| Team ($249/mo)      | Mid-Market Scale  | Seats + Data Volume | 85% Gross Margin              |
| Enterprise ($25k+)  | Fortune 500       | Custom Unlimited    | 90%+ Gross Margin             |
+---------------------+-------------------+---------------------+-------------------------------+
ANNUAL RECURRING REVENUE EXPANSION: NET DOLLAR RETENTION (120% NDR)
ARR Growth ($)
  $500k |                                                  +----------------------+
        |                                                  | Enterprise Expansion |
  $350k |                                    +-------------+ (Value-Metric Driven)|
        |                      +-------------+                                    |
  $200k |        +-------------+ Initial Land Contract ($100k Base)               |
        +--------+-------------+-------------+-------------+----------------------+
        Year 1   Year 2        Year 3        Year 4        Year 5
The Value Metric: The Engine of Net Dollar Retention (NDR)
The single most critical design decision in SaaS monetization is the choice of Value Metric—the unit of consumption that drives pricing tiers: - Per-Seat Licensing: Classical but misaligned; penalizes team collaboration and incentivizes password sharing. - Consumption / Usage Metrics: Aligning price with API requests, gigabytes of database storage, or monthly tracked users (MTUs). - Outcome / Value Metrics: Percentage of payment volume processed (Stripe), ad spend managed, or resolved support tickets.
When pricing scales naturally with the customer's business growth, the enterprise achieves Net Dollar Retention (NDR) exceeding 120%, generating massive compounding revenue without incurring additional customer acquisition costs.
7. Production Implementation: Full TypeScript Enterprise Pricing & Breakeven Engine
Production-ready, zero-dependency financial pricing engine in pure TypeScript.
Complete Production TypeScript Pricing & Breakeven Engine
Below is the verified, zero-dependency TypeScript implementation of our enterprise pricing engine, supporting bidirectional margin-to-markup conversions, breakeven volume analysis, and multi-tier discounting models:
export interface PricingInput {
  costOfGoodsSold: number;
  targetGrossMarginPercent?: number; // e.g. 60 for 60%
  targetMarkupPercent?: number;      // e.g. 150 for 150%
  fixedOperatingCosts?: number;     // e.g. $250,000
  targetProfitGoal?: number;         // e.g. $100,000
}

export interface PricingAnalysisOutput {
  sellingPrice: number;
  grossProfitDollars: number;
  grossMarginPercent: number;
  markupPercent: number;
  breakevenUnits: number;
  breakevenRevenue: number;
  unitsToTargetProfit: number;
  revenueToTargetProfit: number;
  discountSensitivity: {
    discountPercent: number;
    discountedPrice: number;
    newGrossProfit: number;
    newGrossMarginPercent: number;
    requiredVolumeIncreasePercent: number;
  }[];
}

export class EnterprisePricingEngine {
  public static calculate(input: PricingInput): PricingAnalysisOutput {
    const cogs = Math.max(0, input.costOfGoodsSold);
    const fixedCosts = Math.max(0, input.fixedOperatingCosts || 0);
    const targetProfit = Math.max(0, input.targetProfitGoal || 0);

    let sellingPrice = 0;
    let marginPercent = 0;
    let markupPercent = 0;

    // 1. Solve for Price based on Margin or Markup input
    if (input.targetGrossMarginPercent !== undefined) {
      marginPercent = Math.min(99.99, Math.max(0, input.targetGrossMarginPercent));
      const marginFraction = marginPercent / 100.0;
      sellingPrice = cogs / (1.0 - marginFraction);
      markupPercent = ((sellingPrice - cogs) / cogs) * 100.0;
    } else if (input.targetMarkupPercent !== undefined) {
      markupPercent = Math.max(0, input.targetMarkupPercent);
      const markupFraction = markupPercent / 100.0;
      sellingPrice = cogs * (1.0 + markupFraction);
      marginPercent = ((sellingPrice - cogs) / sellingPrice) * 100.0;
    } else {
      // Default to 50% margin if neither provided
      marginPercent = 50.0;
      sellingPrice = cogs / 0.50;
      markupPercent = 100.0;
    }

    const grossProfitDollars = sellingPrice - cogs;
    const unitContributionMargin = grossProfitDollars; // Assuming COGS is variable

    // 2. Breakeven Volume Calculus
    const breakevenUnits = unitContributionMargin > 0 ? Math.ceil(fixedCosts / unitContributionMargin) : Infinity;
    const breakevenRevenue = breakevenUnits * sellingPrice;

    // 3. Units and Revenue to Target Profit
    const unitsToTargetProfit = unitContributionMargin > 0 ? Math.ceil((fixedCosts + targetProfit) / unitContributionMargin) : Infinity;
    const revenueToTargetProfit = unitsToTargetProfit * sellingPrice;

    // 4. Discount Sensitivity Modeling (5%, 10%, 15%, 20%, 25%)
    const discountTiers = [5, 10, 15, 20, 25];
    const discountSensitivity = discountTiers.map(discount => {
      const discountedPrice = sellingPrice * (1 - discount / 100.0);
      const newGrossProfit = discountedPrice - cogs;
      const newGrossMarginPercent = discountedPrice > 0 ? (newGrossProfit / discountedPrice) * 100.0 : 0;

      // Volume penalty formula: required multiplier = original profit / new profit
      const volumeMultiplier = newGrossProfit > 0 ? grossProfitDollars / newGrossProfit : Infinity;
      const requiredVolumeIncreasePercent = isFinite(volumeMultiplier) ? (volumeMultiplier - 1.0) * 100.0 : Infinity;

      return {
        discountPercent: discount,
        discountedPrice: Math.round(discountedPrice * 100) / 100,
        newGrossProfit: Math.round(newGrossProfit * 100) / 100,
        newGrossMarginPercent: Math.round(newGrossMarginPercent * 10) / 10,
        requiredVolumeIncreasePercent: Math.round(requiredVolumeIncreasePercent * 10) / 10
      };
    });

    return {
      sellingPrice: Math.round(sellingPrice * 100) / 100,
      grossProfitDollars: Math.round(grossProfitDollars * 100) / 100,
      grossMarginPercent: Math.round(marginPercent * 10) / 10,
      markupPercent: Math.round(markupPercent * 10) / 10,
      breakevenUnits,
      breakevenRevenue: Math.round(breakevenRevenue * 100) / 100,
      unitsToTargetProfit,
      revenueToTargetProfit: Math.round(revenueToTargetProfit * 100) / 100,
      discountSensitivity
    };
  }
}
This pricing engine powers our in-browser [Enterprise Margin, Markup Multiplier & Breakeven Pricing Engine Pro](/tools/margin-markup-calculator), computing instantaneous sensitivity tables and breakeven volumes with zero server latency.
8. Industrial Pricing Playbook: Cross-Industry Margins & Technical FAQ
Macro-industry gross margin benchmarks, price-raising playbooks, and corporate pricing FAQ.
Cross-Industry Empirical Gross Margin Benchmarks
Gross margin profiles vary dramatically across economic sectors, dictating operating leverage, enterprise multiples, and acceptable customer acquisition costs (CAC). The following benchmark table summarizes empirical margin baselines across major industry sectors:
+-------------------------------------------------------------------------------------------------------------------------+
|                  CROSS-INDUSTRY GROSS MARGIN & PRICING BENCHMARK MATRIX                                                 |
+---------------------+-------------------+---------------------+-------------------+---------------------+---------------+
| Industry Sector     | Benchmark Margin  | Benchmark Markup    | Variable Cost Mix | Primary Pricing Model| EV / Sales Mult|
+---------------------+-------------------+---------------------+-------------------+---------------------+---------------+
| Enterprise SaaS     | 75% - 88%         | 300% - 733%         | AWS, APIs, Support| Value-Based Tiered  | 8x - 15x      |
| Digital E-Commerce  | 40% - 55%         | 67% - 122%          | Manufacturing,Ship| Cost-Plus / Dynamic | 1x - 2.5x     |
| Medical Devices     | 65% - 80%         | 185% - 400%         | Sterile Precision | Value / Outcome     | 4x - 7x       |
| Consumer Electronics| 25% - 45%         | 33% - 82%           | Hardware, Assembly| Competitive Tiered  | 1.5x - 3x     |
| Physical Retail     | 20% - 35%         | 25% - 54%           | Wholesale Stock   | Keystoning (100% mk)| 0.5x - 1.2x   |
| Commercial Banking  | 50% - 65% (NIM)   | Spread Multipliers  | Cost of Deposits  | Net Interest Margin | 2x - 4x       |
+---------------------+-------------------+---------------------+-------------------+---------------------+---------------+
### Executive Playbook for Raising Prices Without Customer Churn 1. Grandfather Existing Accounts for 12 Months: Announce price increases 60 days in advance, but grant existing customers a 12-month grandfathered rate. This completely neutralizes immediate churn while incentivizing fence-sitters to lock in multi-year renewals. 2. Bundle New Features with Price Increases: Never increase prices on an identical static product without narrative framing. Release major new capabilities (AI workflows, elevated compliance, faster SLAs) simultaneously with the price revision. 3. Align With Inflation and Value Metrics: Frame adjustments around enterprise infrastructure investments, enhanced security attestations, and expanded platform capacity. 4. Quantify the Discount Volume Penalty: Before any sales representative offers an enterprise discount, require them to model the required volume compensatory penalty using the [Enterprise Margin, Markup Multiplier & Breakeven Pricing Engine Pro](/tools/margin-markup-calculator).
Empirical Cross-Industry Margin & Enterprise Multiple Benchmark Matrix
| Industry Sector | Gross Margin Range | Required Markup | COGS Breakdown | Primary Pricing Model | Enterprise EV/Sales Multiple |
|---|---|---|---|---|---|
| Enterprise Cloud SaaS | 75% - 88% | 300% - 733% | AWS, Compute, Support | Value-Based Tiered | 8.0x - 15.0x |
| Digital E-Commerce | 40% - 55% | 67% - 122% | Materials, Shipping | Cost-Plus / Dynamic | 1.0x - 2.5x |
| Medical Devices | 65% - 80% | 185% - 400% | Sterile Precision Manuf | Value / Clinical Outcome | 4.0x - 7.0x |
| Consumer Hardware | 25% - 45% | 33% - 82% | Tooling, Assembly | Competitive Tiered | 1.5x - 3.0x |
| Wholesale Distribution | 15% - 25% | 18% - 33% | Inventory Procurement | Volume Cost-Plus | 0.4x - 0.8x |
Empirical benchmark evaluation of corporate gross profit margins, required markups, and enterprise valuation multiples across leading industrial sectors.
Frequently Asked Technical Questions
What is the fundamental mathematical difference between gross margin and markup?
Gross margin divides profit by the selling price (Profit / Price), representing the fraction of top-line revenue retained after direct production costs. Markup divides profit by the cost of goods sold (Profit / Cost), representing the percentage added to the base cost to establish the price. Margin is strictly bounded between 0% and 100%, whereas markup is unbounded and approaches infinity as margin approaches 100%.
Why is an 80% markup not equivalent to an 80% gross margin?
Because of the different denominators. An 80% markup on a $100 cost yields a $180 selling price ($80 profit). The gross margin on that $180 price is $80 / $180 = 44.4%, not 80%. To achieve a true 80% gross margin, you must apply a 400% markup ($100 cost + $400 markup = $500 selling price; $400 profit / $500 price = 80% margin).
How does offering a discount destroy profitability faster than expected?
Discounts come directly out of gross profit, not out of total revenue or cost. For a company operating at a 30% gross margin, a 15% price discount reduces the gross profit dollar margin by 50%. The business must now sell exactly 100% more unit volume just to generate the same gross profit dollars.
What is Price Elasticity of Demand (PED), and why does it matter?
Price Elasticity of Demand measures how sensitive customer purchase volume is to price changes (% change in quantity divided by % change in price). If demand is inelastic (|PED| < 1), raising prices expands total revenue because the price gain outweighs the volume loss. If demand is elastic (|PED| > 1), raising prices reduces total revenue.
How do you calculate the breakeven point in unit sales?
Breakeven units equal total fixed operating costs divided by the unit contribution margin (Selling Price minus Variable Cost per unit). Each unit sold contributes its margin toward covering fixed overhead until total cumulative profit equals zero.
What is the difference between COGS and OPEX?
COGS (Cost of Goods Sold) includes only direct expenses required to produce or deliver the product (raw materials, direct labor, cloud hosting for active users). OPEX (Operating Expenses) includes general business period costs like R&D, sales commissions, marketing campaigns, and executive salaries, which are subtracted below gross profit.
Why do B2B SaaS companies target gross margins above 80%?
High gross margins (80%+) provide the massive operating leverage required to fund heavy sales, marketing, and continuous R&D software engineering. Public SaaS companies with 80%+ margins command significantly higher valuation multiples (EV/Revenue) than low-margin businesses.
Where can I simulate pricing changes, markups, and breakeven horizons in my browser?
You can use our InnoX Enterprise Margin, Markup Multiplier & Breakeven Pricing Engine Pro (/tools/margin-markup-calculator). It calculates instant margin-to-markup conversions, computes breakeven unit volumes, and models discount sensitivity penalties client-side.
Engineering Discussion & Feedback
Join the technical debate or ask questions about this guide.
Need Custom AI, Web, or Enterprise Software Engineering?
InnoxTools is built and maintained by INNO XPERT. We design mission-critical cloud backends, custom machine learning models, mobile apps, and high-performance digital solutions for businesses worldwide.