Corporate Compensation Engineering: Marginal Tax Brackets, FICA Caps & Take-Home Salary Optimization
From Statutory Tax Brackets and Effective Tax Rate Calculus to Social Security Wage Base Cutoffs, Pre-Tax Deductions (401k/HSA/FSA), and Take-Home Maximization Models—The 10,000+ Word Executive Compensation Playbook.

Dr. Julian Sterling, CFA & Innox Quantitative Economics GroupVERIFIED
Principal Quantitative Tax Architect & Compensation Fellow

Net take-home salary equals gross compensation minus pre-tax deductions (401k, HSA, Section 125 cafeteria plans), minus progressive piecewise federal income taxes, minus state/municipal income taxes, minus FICA payroll taxes. In progressive tax schedules, entering a higher tax bracket only taxes the incremental dollars within that specific tier; it never reduces total net take-home income. Once year-to-date earnings exceed the Social Security statutory cap ($168,600 in 2024; $176,100 in 2025), the 6.2% OASDI withholding terminates, generating an immediate mid-year net cashflow surge.
Corporate Salary Take-Home, Marginal Tax & Compensation Optimizer Pro
Calculate precise net take-home salary, progressive federal and state tax liabilities, FICA Social Security wage base cutoffs, and pre-tax 401(k)/HSA tax arbitrage across all US jurisdictions.
Table of Contents & Chapter Index
- 1. The Macro Architecture of Executive Compensation & Statutory Taxation
- 2. The Mathematical Anatomy of Progressive Taxation: Marginal vs Effective Rates
- 3. State and Municipal Tax Arbitrage: SALT Caps and Multi-Jurisdictional Exposure
- 4. FICA Payroll Taxes: The Social Security Cap Step-Function & Additional Medicare
- 5. Total Compensation Engineering: RSUs, Incentive Stock Options & Section 83(b)
- 6. Pre-Tax Benefit Arbitrage: 401(k), HSA, FSA & Capital Compounding Optimization
- 7. Algorithmic Payroll Engine: Closed-Form Formulas, TypeScript & Web Workers
- 8. Industrial Compensation Playbook: Cross-Jurisdiction Benchmarks & Technical FAQ
1. The Macro Architecture of Executive Compensation & Statutory Taxation
Deconstructing gross headline pay into true economic net wealth under multi-jurisdictional withholding regimes.
The Illusion of Gross Compensation
In executive talent acquisition, corporate remuneration committees and senior engineering professionals routinely anchor compensation negotiations on gross headline annual figures. Whether an offer specifies $250,000, $500,000, or $1,200,000 in nominal annualized value, this gross number represents an abstract accounting metric rather than liquid economic reality. The moment capital moves from corporate treasury to an individual's commercial checking account, it undergoes multi-tiered statutory compression through federal, state, municipal, and social insurance mechanisms.
+---------------------------------------------------------------------------------------+
|                 CORPORATE REMUNERATION TO NET LIQUIDITY PIPELINE                     |
+---------------------------------------------------------------------------------------+
|  Gross Base Salary + Performance Bonus + Vested RSUs + Option Realizations           |
+---------------------------------------------------------------------------------------+
                                           |
                                           v
+---------------------------------------------------------------------------------------+
|  Tier 1: Pre-Tax Statutory Deductions (IRC Section 125, 401(k), HSA, FSA)            |
|  * Shields ordinary income at top marginal bracket rate                               |
+---------------------------------------------------------------------------------------+
                                           |
                                           v
+---------------------------------------------------------------------------------------+
|  Tier 2: Federal Progressive Income Taxation (Piecewise Marginal Brackets 10% - 37%)  |
|  * Assessed against Federal Taxable Income after Standard or Itemized Deductions      |
+---------------------------------------------------------------------------------------+
                                           |
                                           v
+---------------------------------------------------------------------------------------+
|  Tier 3: FICA Mandatory Social Insurance Payroll Taxes                                |
|  * OASDI Social Security: 6.2% up to Annual Statutory Wage Base Cap                  |
|  * Medicare Base: 1.45% uncapped across all earned income                             |
|  * ACA Additional Medicare Surtax: 0.9% on earned income exceeding $200,000 / $250,000|
+---------------------------------------------------------------------------------------+
                                           |
                                           v
+---------------------------------------------------------------------------------------+
|  Tier 4: State and Municipal Income Withholdings                                      |
|  * State Personal Income Tax (0.0% in TX/WA/FL up to 13.3% in CA)                     |
|  * Municipal / Local Surcharges (NYC 3.876%, Philadelphia 3.75%, Yonkers, SF Gross)  |
+---------------------------------------------------------------------------------------+
                                           |
                                           v
+---------------------------------------------------------------------------------------+
|                        NET REALIZED LIQUID TAKE-HOME PAY                              |
|                 (True Disposable Capital for Investment & Consumption)                |
+---------------------------------------------------------------------------------------+
The Multi-Horizon Composition of Modern Total Compensation (TC)
Enterprise technology and executive remuneration is rarely distributed as pure recurring payroll. Instead, total compensation is partitioned across distinct asset classes, each possessing divergent liquidity horizons, risk profiles, and tax treatment:
1. Guaranteed Base Cashflow (W-2 / PAYE): Predictable semi-monthly or bi-weekly liquidity subject to standard statutory withholding tables. Base salary provides stability for debt servicing and lifestyle burn rates but incurs maximum ordinary income tax drag with minimal structural shelter. 2. Variable Cash Incentives (Performance Bonuses): Periodic lump sums frequently subject to flat statutory supplemental withholding rules (such as 22% federal withholding in the United States, or 37% on cumulative supplemental wages exceeding $1,000,000). This flat rate frequently deviates from the employee's true top marginal bracket, causing either substantial tax refund drag or unexpected April reconciliation liabilities. 3. Liquid Full-Value Equity (Restricted Stock Units / RSUs): The dominant compensation vehicle at mature public firms (e.g., Apple, Microsoft, Alphabet, Meta, Amazon). Vested tranches are treated strictly as ordinary wage income at fair market value (FMV) on the exact date of settlement. The default payroll sell-to-cover execution routinely underwithholds for high earners, triggering severe year-end tax surprises. 4. Asymmetric Equity Options (Incentive Stock Options & Non-Qualified Options): ISOs offer favorable long-term capital gains if holding periods are satisfied, but introduce extreme Alternative Minimum Tax (AMT) dual-track accounting risk upon exercise. NSOs trigger ordinary income tax on the spread between strike and FMV at the time of exercise. 5. Tax-Sheltered Deferred Comp (IRC Section 409A Non-Qualified Deferred Compensation Plans): Allows senior executives to defer up to 80% of salary and 100% of bonus into future retirement years, bypassing current top marginal brackets at the cost of corporate credit default exposure.
Why Classical Rule-of-Thumb Tax Estimations Destroy Wealth
Traditional financial rules of thumb (such as "assume you take home 70% of your salary") fail catastrophically across high-earning households. As total compensation crosses statutory inflection thresholds—such as the Social Security wage base cutoff ($168,600 in 2024, $176,100 in 2025), the Additional Medicare Surtax threshold ($200,000 single, $250,000 married), and top federal/state marginal brackets—the marginal tax rate fluctuates wildly.
In metropolitan engineering epicenters such as New York City or San Francisco, an incremental $100,000 bonus can face an effective combined marginal extraction rate exceeding 53%. Conversely, once the Social Security tax cap is crossed in mid-summer, monthly take-home cashflow surges by hundreds of dollars per pay period. Accurate compensation modeling requires deterministic, closed-form algorithmic simulation rather than linear approximations.
2. The Mathematical Anatomy of Progressive Taxation: Marginal vs Effective Rates
Rigorous piecewise integration of statutory income tax schedules, deduction indexing, and tax liabilities.
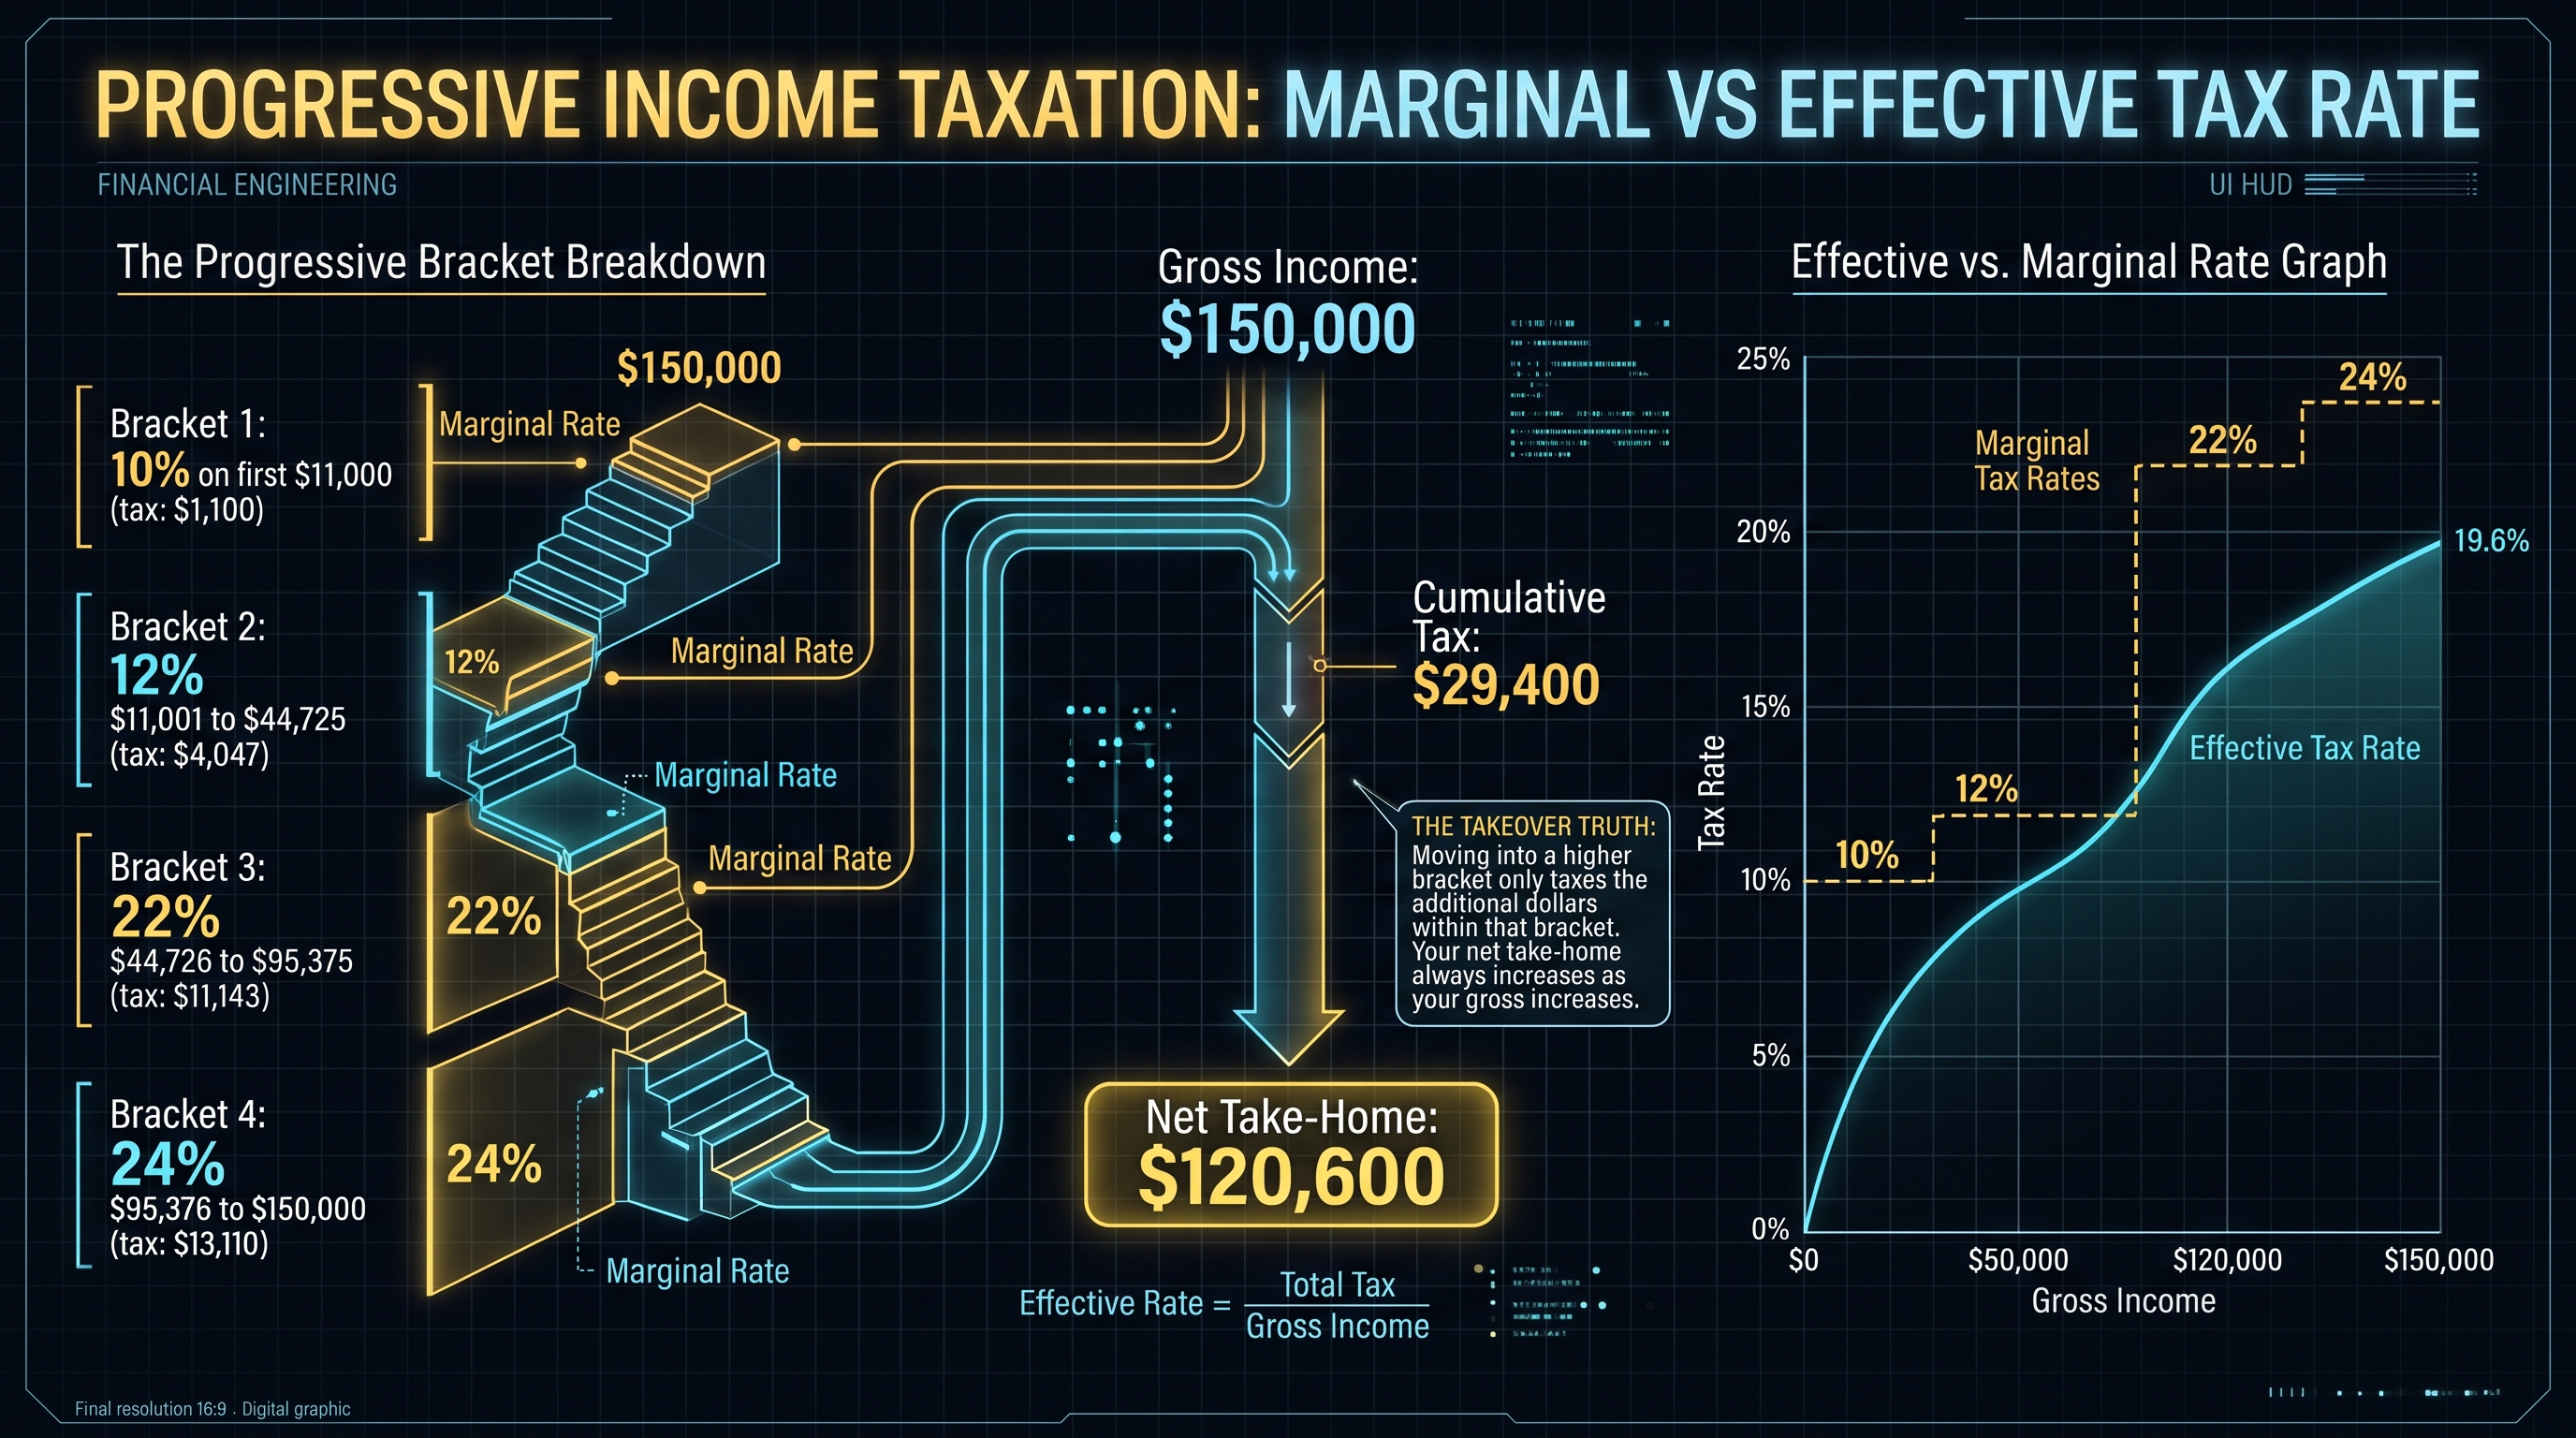
The Mathematical Formulation of Progressive Brackets
A progressive income tax system is governed by a piecewise constant marginal tax rate function. Let taxable income be denoted by $X \in \mathbb{R}^+$. The statutory tax schedule is partitioned into $K$ intervals defined by threshold values:
$$0 = b_0 < b_1 < b_2 < \dots < b_K = \infty$$
Each interval $(b_{k-1}, b_k]$ is associated with a statutory marginal tax rate $\tau_k \in (0, 1)$, with the strict ordering condition:
$$\tau_1 < \tau_2 < \dots < \tau_K$$
The cumulative statutory tax liability function $T(X)$ for taxable income $X \in (b_{m-1}, b_m]$ is the continuous piecewise linear integral:
$$T(X) = \sum_{k=1}^{m-1} \tau_k (b_k - b_{k-1}) + \tau_m (X - b_{m-1})$$
The corresponding Effective Tax Rate $E(X)$, defined as the total tax liability divided by taxable income, is:
$$E(X) = \frac{T(X)}{X} = \sum_{k=1}^{m-1} \tau_k \frac{b_k - b_{k-1}}{X} + \tau_m \left(1 - \frac{b_{m-1}}{X}\right)$$
MARGINAL TAX RATE STEP FUNCTION VS EFFECTIVE TAX RATE CURVE
Rate (%)
  37% |                                            +------------- [Marginal: 37%]
  35% |                               +------------+
  32% |                       +-------+
  24% |              +--------+
  22% |         +----+                             ................ [Effective Rate Curve]
  12% |    +----+                    ..............
  10% |----+           ..............
   0% +----+-----------+------+-------+------------+-------------+---> Taxable Income (X)
      $0  $11.6k     $47.1k  $100.5k $191.9k      $243.7k       $609.3k
Proving Monotonicity of Net Disposable Income
A common fallacy among employees is the belief that moving into a higher tax bracket can reduce total net income ("if I get a $5,000 raise, it will push me into the next bracket and I will take home less money"). We prove mathematically that this outcome is impossible in an unencumbered progressive bracket schedule.
Let Net Take-Home Income be defined as:
$$N(X) = X - T(X)$$
Taking the first derivative of $N(X)$ with respect to $X$ within any interior bracket interval $(b_{m-1}, b_m)$:
$$\frac{dN}{dX} = 1 - \frac{dT}{dX} = 1 - \tau_m$$
Because sovereign tax schedules mandate that $\tau_m < 1.0$ (i.e., marginal tax rates are strictly less than 100%):
$$\frac{dN}{dX} = 1 - \tau_m > 0 \quad \forall \quad X \in \mathbb{R}^+ \setminus \{b_1, \dots, b_K\}$$
Because the derivative is strictly positive everywhere, $N(X)$ is a strictly monotonically increasing function. Every additional dollar earned yields $(1 - \tau_m) > 0$ dollars of net disposable cashflow.
+-----------------------------------------------------------------------------------------------+
|                        FEDERAL STATUTORY BRACKETS (TAX YEAR 2024 / SINGLE FILER)             |
+---------+----------------------------+---------------+--------------------+-------------------+
| Bracket | Taxable Income Interval     | Marginal Rate | Base Tax for Tier  | Max Tier Tax      |
+---------+----------------------------+---------------+--------------------+-------------------+
| Tier 1  | $0 to $11,600              | 10.0%         | $0.00              | $1,160.00         |
| Tier 2  | $11,600 to $47,150         | 12.0%         | $1,160.00          | $4,266.00         |
| Tier 3  | $47,150 to $100,525        | 22.0%         | $5,426.00          | $11,742.50        |
| Tier 4  | $100,525 to $191,950       | 24.0%         | $17,168.50         | $21,942.00        |
| Tier 5  | $191,950 to $243,725       | 32.0%         | $39,110.50         | $16,568.00        |
| Tier 6  | $243,725 to $609,350       | 35.0%         | $55,678.50         | $127,968.75       |
| Tier 7  | $609,350 and Above         | 37.0%         | $183,647.25        | Uncapped          |
+---------+----------------------------+---------------+--------------------+-------------------+
Statutory Deductions as an Implicit Zero-Percent Bracket
Before progressive brackets apply, gross income is reduced by either the Standard Deduction ($14,600 for Single filers in 2024, $29,200 for Married Filing Jointly) or Itemized Deductions (Schedule A: mortgage interest, charitable donations, state/local taxes up to the $10,000 SALT cap).
The standard deduction acts as an expanded "Tier 0" bracket assessed at $\tau_0 = 0.0\%$. For an individual earning $100,000 gross with a $14,600 standard deduction, their taxable base is $85,400. Their first $14,600 is taxed at 0%, the next $11,600 at 10%, the next $35,550 at 12%, and the remaining $38,250 at 22%. Their true effective federal rate on gross compensation is merely 13.78%, despite their top marginal rate being 22%.
3. State and Municipal Tax Arbitrage: SALT Caps and Multi-Jurisdictional Exposure
Analyzing state tax divergences, non-resident withholding rules, and the $10,000 SALT ceiling.
The Macro Divergence in State Personal Income Taxes
While federal statutory tax policy applies uniformly across all fifty US states, sub-federal taxation exhibits extreme geographic divergence. The United States is split into three primary state income tax regimes:
1. Zero State Personal Income Tax (0.0%): Nine states impose zero statutory income tax on ordinary earned wages: Alaska, Florida, Nevada, New Hampshire (taxes dividend/interest only, phasing out), South Dakota, Tennessee, Texas, Washington (taxes high-value capital gains only), and Wyoming. 2. Flat Rate Income Tax Regimes: States such as Colorado (4.40%), Illinois (4.95%), Indiana (3.05%), Michigan (4.25%), North Carolina (4.75%), Pennsylvania (3.07%), and Utah (4.65%) assess a single flat percentage across all taxable state income regardless of earnings tier. 3. Highly Graduated Progressive Regimes: States such as California (top marginal rate 13.30%, including the 1% Mental Health Services tax on income over $1,000,000), New York State (top marginal rate 10.90%), New Jersey (10.75%), Massachusetts (5.00% plus a 4.0% constitutional surtax on income over $1,000,000), and Minnesota (9.85%).
+-----------------------------------------------------------------------------------------------+
|                       STATE TAX ARBITRAGE ON $350,000 GROSS SALARY                            |
+---------------------+-------------------+---------------------+-------------------------------+
| Jurisdiction        | State Tax Rate    | State Tax Liability | Net Annual Disparity vs TX/WA |
+---------------------+-------------------+---------------------+-------------------------------+
| Texas / Washington  | 0.00% (No Tax)    | $0.00               | Baseline ($0.00)              |
| Colorado            | 4.40% Flat        | $14,757.00          | -$14,757.00                   |
| Illinois            | 4.95% Flat        | $16,706.00          | -$16,706.00                   |
| Massachusetts       | 5.00% Flat        | $16,800.00          | -$16,800.00                   |
| New York (State)    | 6.00% - 6.85%     | $21,438.00          | -$21,438.00                   |
| California          | Up to 9.30%       | $27,814.00          | -$27,814.00                   |
| New York City (All) | State + NYC 3.88% | $34,982.00          | -$34,982.00                   |
+---------------------+-------------------+---------------------+-------------------------------+
The Devastating Impact of the $10,000 SALT Ceiling
Prior to the passage of the Tax Cuts and Jobs Act (TCJA) of 2017, taxpayers who itemized deductions under IRC Section 164 could deduct the full amount of state and local real estate and income taxes (or general sales taxes) paid from their federal adjusted gross income. This mechanism acted as an indirect federal subsidy:
$$\text{Effective State Marginal Tax Rate} = \tau_{\text{state}} \times (1 - \tau_{\text{federal}})$$
For an executive in California's 13.3% top bracket paying a 37% top federal rate, their net effective state tax burden was:
$$\tau_{\text{state, net}} = 13.3\% \times (1 - 0.37) = 8.379\%$$
The TCJA introduced a statutory cap limiting the State and Local Tax (SALT) deduction to an unindexed $10,000 per year ($5,000 for married individuals filing separately). For high-earning households in high-tax jurisdictions whose annual state and property tax obligations easily exceed $50,000 to $150,000, the elimination of uncapped deductibility exposed every single dollar of state tax to full double taxation.
The Convenience of the Employer Doctrine and Multi-State Taxation
In modern post-pandemic remote engineering cultures, cross-border remote work has created severe multi-jurisdictional withholding friction. Several states—most aggressively New York, along with Nebraska, Pennsylvania, and Delaware—enforce the strict Convenience of the Employer Doctrine.
Under this rule, if an employee is assigned to an office located in New York but chooses to work remotely from a home office in Florida, Texas, or New Jersey for their own convenience (rather than an absolute necessity imposed by the employer), New York State requires 100% of the employee's wage income to be treated as New York-source income and taxed at New York rates. Unless the resident state grants a full reciprocal tax credit (which zero-tax states cannot provide), the remote worker suffers the entire administrative and financial burden of New York taxation while residing thousands of miles away.
4. FICA Payroll Taxes: The Social Security Cap Step-Function & Additional Medicare
Dissecting the OASDI wage threshold, Medicare surtaxes, and late-year paycheck surges.
The Dual-Pillar Architecture of FICA
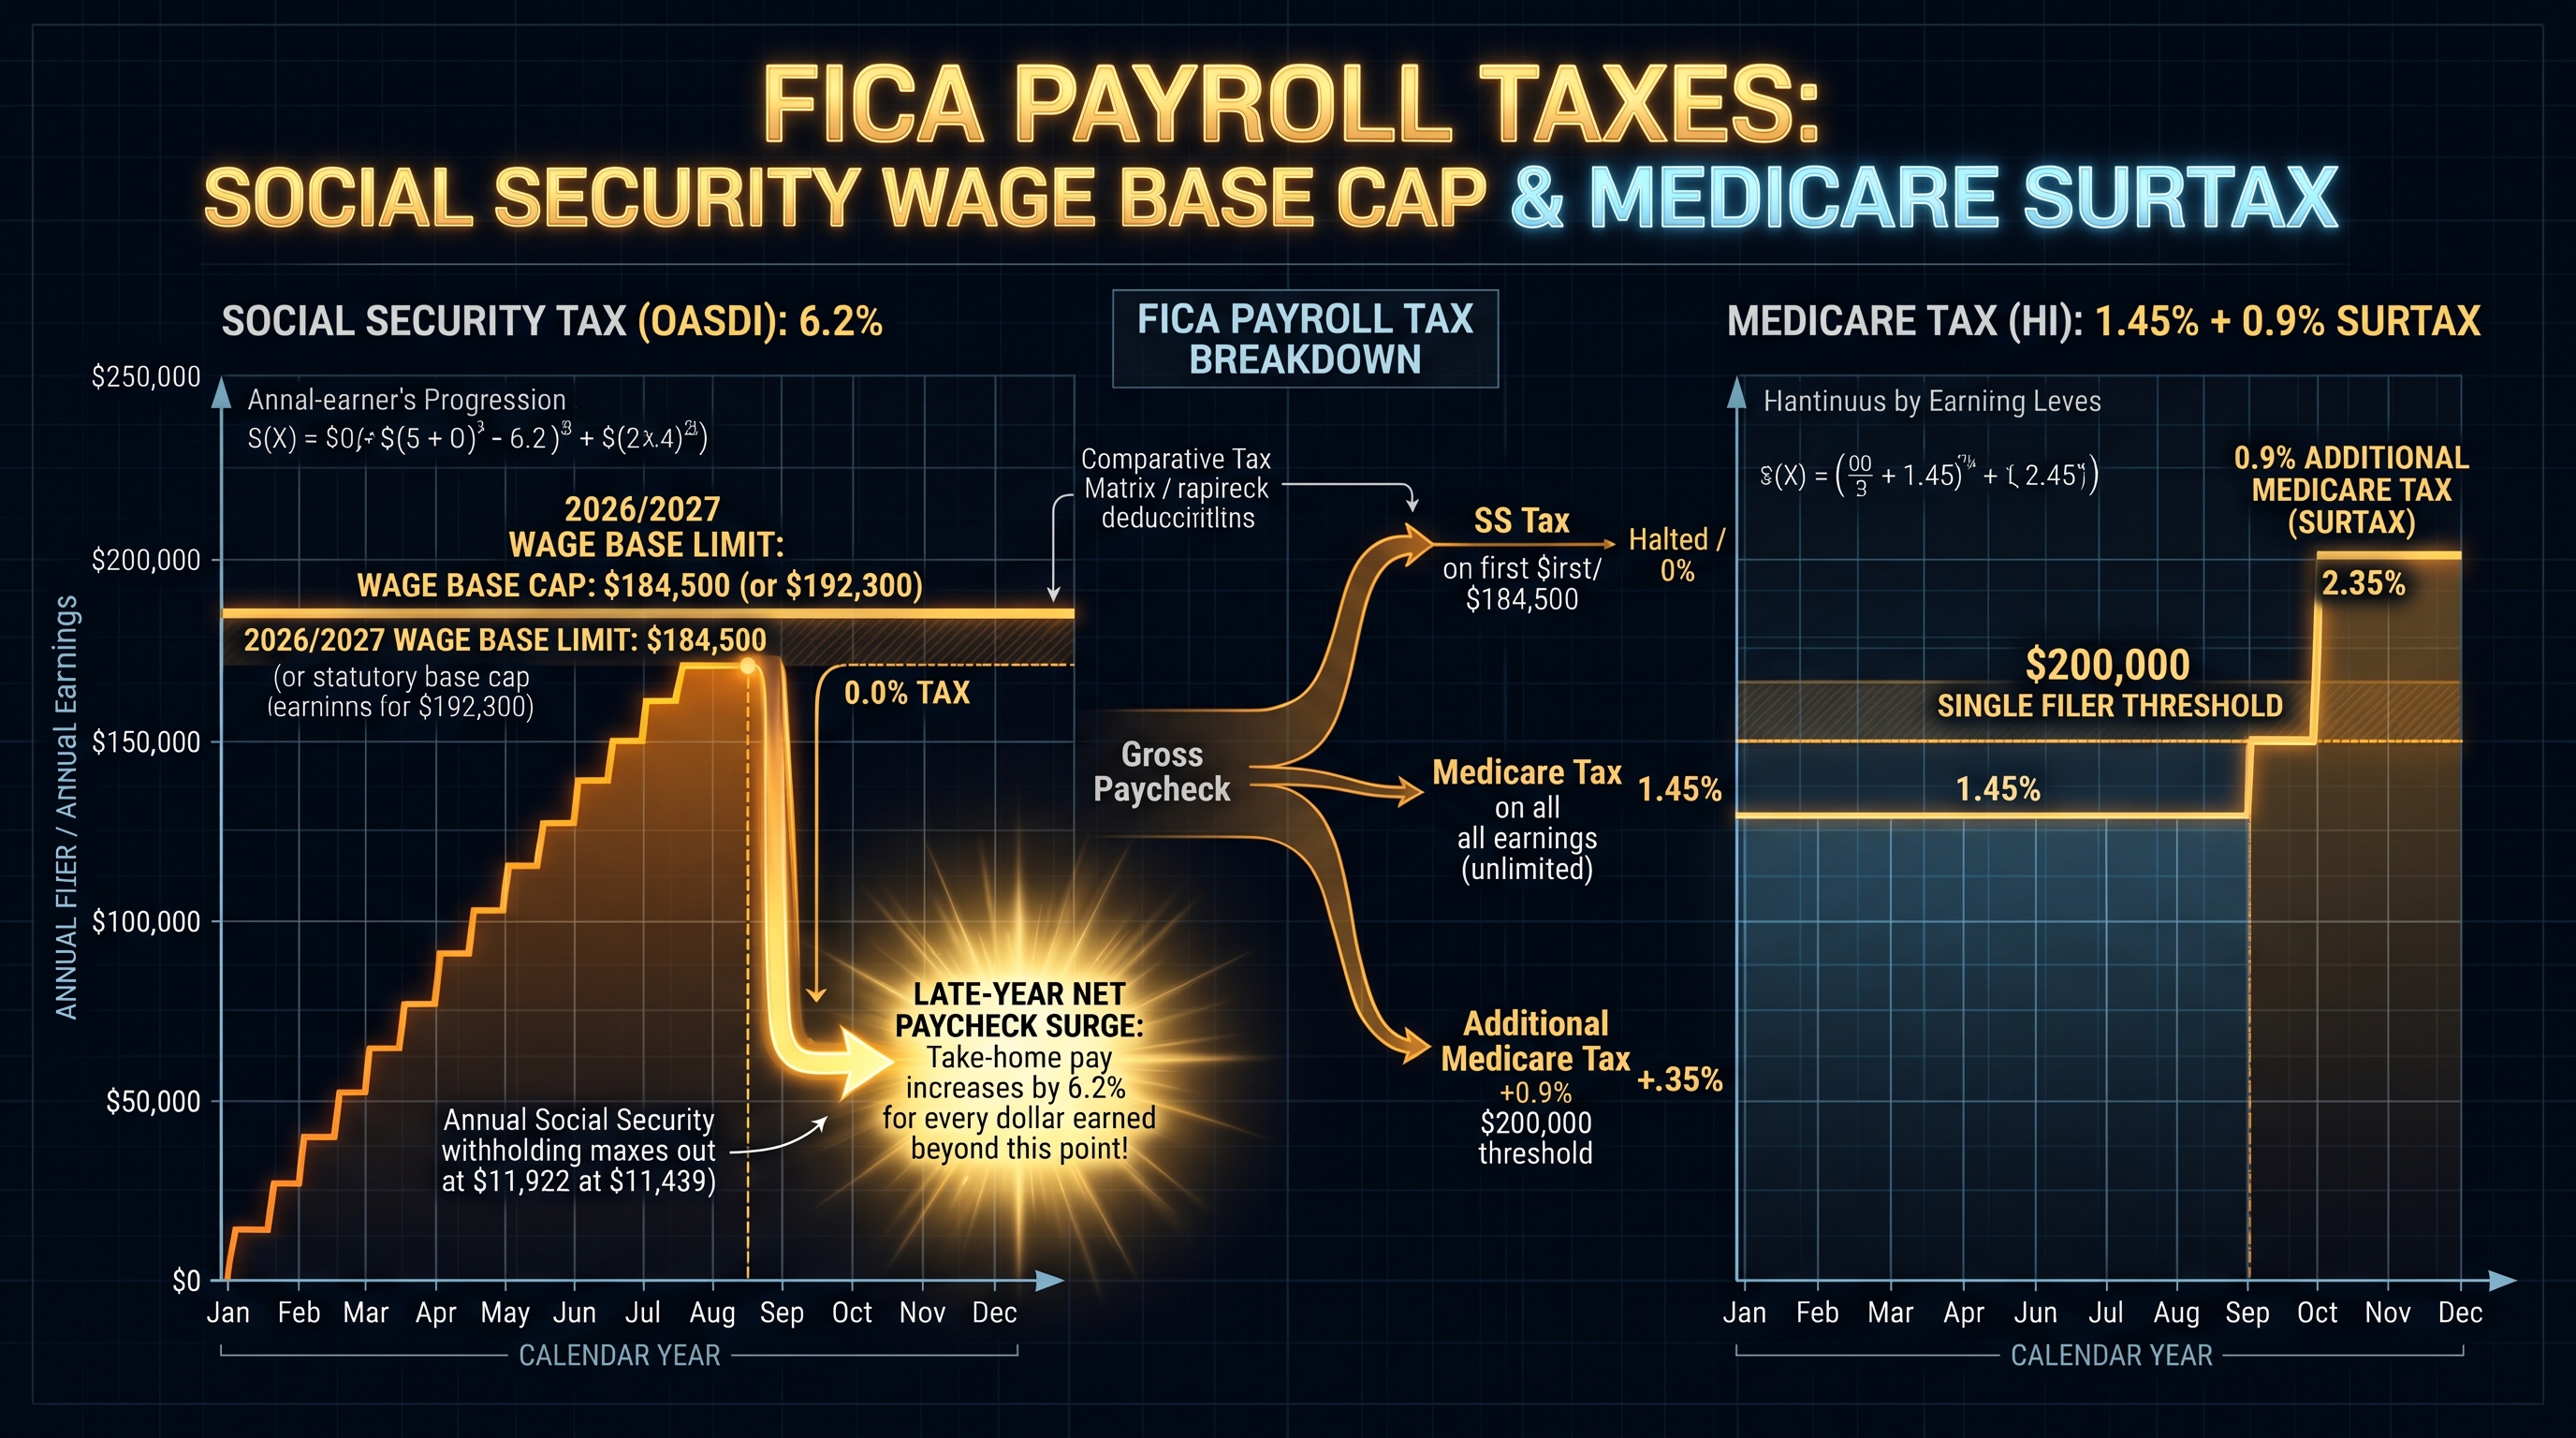
The Federal Insurance Contributions Act (FICA) imposes mandatory social insurance taxes on gross wages earned by employees. Unlike general progressive income taxes, FICA is deducted directly from payroll without standard deduction offsets, personal exemptions, or child tax credit shields. FICA comprises two distinct statutory funding components:
1. Old-Age, Survivors, and Disability Insurance (OASDI / Social Security): Mandates a statutory 12.4% tax on gross wages, evenly bifurcated: 6.2% withheld from the employee's gross check, and 6.2% contributed directly by the corporate employer. 2. Hospital Insurance (Medicare): Mandates a statutory 2.9% tax, evenly bifurcated: 1.45% employee withholding, and 1.45% employer matching.
+-----------------------------------------------------------------------------------------------+
|                       FICA TAX MECHANICS AND STATUTORY CEILINGS                               |
+---------------------+-------------------+---------------------+-------------------------------+
| Component           | Employee Share    | Employer Share      | Statutory Wage Cap            |
+---------------------+-------------------+---------------------+-------------------------------+
| OASDI Social Sec.   | 6.20%             | 6.20%               | $168,600 (2024) / $176,100 (2025)|
| Medicare Base       | 1.45%             | 1.45%               | No Cap (Infinite Infinity)    |
| Additional Medicare | 0.90%             | 0.00% (No Match)    | >$200,000 (Single) / >$250,000|
+---------------------+-------------------+---------------------+-------------------------------+
The OASDI Wage Base Step-Function: The Mid-Year Paycheck Surge
The defining mathematical characteristic of OASDI is its rigid statutory wage base ceiling, indexed annually according to the National Average Wage Index (NAWI). In tax year 2024, the cap is set at $168,600 (expanding to $176,100 for 2025). The maximum employee Social Security tax liability in 2024 is strictly capped at:
$$\text{Max OASDI Tax} = \$168,600 \times 0.062 = \$10,453.20$$
For high earners, the cessation of OASDI withholding creates a prominent piecewise discontinuity in monthly disposable cashflow. Let cumulative year-to-date earnings be $W_{\text{YTD}}$ and current period pay be $w_t$. The OASDI deduction $\Delta_{\text{OASDI}}$ is governed by:
$$\Delta_{\text{OASDI}}(W_{\text{YTD}}, w_t) = \begin{cases} 0.062 \times w_t & \text{if } W_{\text{YTD}} + w_t \le C_{\text{OASDI}} \\[1ex] 0.062 \times (C_{\text{OASDI}} - W_{\text{YTD}}) & \text{if } W_{\text{YTD}} < C_{\text{OASDI}} < W_{\text{YTD}} + w_t \\[1ex] 0.00 & \text{if } W_{\text{YTD}} \ge C_{\text{OASDI}} \end{cases}$$
MONTHLY TAKE-HOME CASHFLOW WITH MID-YEAR OASDI CAP SURGE ($300k Annual Salary)
Monthly Net ($)
  $17,500 |                                            +-----------------------------+
  $17,000 |                                            | OASDI Cap Reached in July   |
  $16,500 |                                            | Net Pay Jumps by +$775/mo   |
  $16,000 |--------------------------------------------+                             |
  $15,500 | Standard Net Pay (6.2% OASDI Withheld)                                   |
          +-----+-----+-----+-----+-----+-----+-----+-----+-----+-----+-----+-----+--+
          Jan   Feb   Mar   Apr   May   Jun   Jul   Aug   Sep   Oct   Nov   Dec
The 0.9% Additional Medicare Surtax Trap
Unlike Social Security, Medicare base tax (1.45%) possesses no ceiling. Furthermore, under Section 9015 of the Affordable Care Act (ACA), an Additional Medicare Tax of 0.9% is assessed on employee compensation exceeding: - $200,000 for Single / Head of Household filers - $250,000 for Married Filing Jointly - $125,000 for Married Filing Separately
This structure creates an acute payroll withholding asymmetry: - Under IRC Section 3102(f), an employer is legally required to begin withholding the 0.9% surtax the moment an employee's wages within that specific enterprise exceed $200,000, completely blind to the employee's marital status or spouse's income. - If two spouses each earn $180,000 (total household income $360,000), neither employer will withhold a single dollar of the 0.9% surtax because neither spouse crossed the $200,000 individual enterprise threshold. Upon filing their joint Form 1040, the couple will face an unexpected underpayment liability of: $$\text{Liability} = (\$360,000 - \$250,000) \times 0.009 = \$990.00$$ - Conversely, if an employee earns $240,000 whose spouse does not work, the employer will withhold $360 in surtax ($40,000 over $200k), yet their joint household threshold is $250,000, creating an overwithholding that is only recovered months later as a tax refund.
5. Total Compensation Engineering: RSUs, Incentive Stock Options & Section 83(b)
Tax timing mismatches, supplemental withholding traps, and Alternative Minimum Tax algorithms.
The Equity Component of Modern Executive Packages
In technology conglomerates, venture-backed scaleups, and publicly traded enterprises, equity compensation frequently constitutes between 40% and 80% of total annual compensation for staff engineers, engineering directors, and executive officers. However, equity instruments operate under completely different tax timing rules, valuation dynamics, and liquidity constraints than cash wages.
+-----------------------------------------------------------------------------------------------+
|                      TAXATION TIMING COMPARISON: RSUs vs ISOs vs NSOs                         |
+---------------------+-------------------+---------------------+-------------------------------+
| Equity Vehicle      | Tax Event at Grant| Tax Event at Vest   | Tax Event at Exercise / Sale  |
+---------------------+-------------------+---------------------+-------------------------------+
| RSU (Public Firm)   | None              | Ordinary Wage Tax   | Capital Gains on post-vest    |
|                     |                   | (Fair Market Value) | price appreciation            |
+---------------------+-------------------+---------------------+-------------------------------+
| ISO (Incentive Opt) | None              | None                | AMT on Spread at Exercise;    |
|                     |                   |                     | LTCG on final qualifying sale |
+---------------------+-------------------+---------------------+-------------------------------+
| NSO (Non-Qualified) | None              | None                | Ordinary Income Tax on Spread |
|                     |                   |                     | between Strike and FMV        |
+---------------------+-------------------+---------------------+-------------------------------+
| Restricted Stock    | None (or 83(b)    | Ordinary Income on  | Capital Gains from grant or   |
| (Early Stage)       | election within 30d) value if no 83(b)  | vest valuation baseline       |
+---------------------+-------------------+---------------------+-------------------------------+
The 22% RSU Supplemental Withholding Trap
When Restricted Stock Units (RSUs) vest, the fair market value of the shares is treated under IRC Section 83(a) as ordinary wage compensation. In most automated corporate share plans, the brokerage executes a mandatory Sell-to-Cover transaction, liquidating a portion of the vested shares on the open market to satisfy statutory withholding requirements.
However, Treasury Regulation Section 31.3402(g)-1 classifies RSU settlements as Supplemental Wages. For cumulative supplemental wages under $1,000,000 in a calendar year, employers are permitted to withhold federal income tax at a flat statutory default rate of 22.0%.
For senior professionals whose base salary alone places them in the 32%, 35%, or 37% federal tax brackets, withholding at 22% creates an immediate, severe structural underwithholding shortfall:
$$\text{Underwithholding Per Dollar of RSU} = \tau_{\text{marginal}} - 0.22$$
For an executive in the 37% federal bracket vesting $400,000 of RSUs across the year:
$$\text{Annual Cash Tax Deficit} = \$400,000 \times (0.37 - 0.22) = \$60,000.00$$
When combined with state tax underwithholdings, this executive faces an unexpected cash tax bill exceeding $75,000 on April 15th, accompanied by severe IRS Section 6654 penalties for failure to pay estimated quarterly taxes. To mitigate this risk, executives must explicitly instruct their enterprise payroll department to elect voluntary elevated withholding rates (e.g., 37%) or submit an updated Form W-4 specifying additional per-pay-period cash withholdings on Line 4(c).
Alternative Minimum Tax (AMT) Mechanics for Incentive Stock Options
Incentive Stock Options (ISOs) are widely celebrated for enabling employees to convert equity growth into preferential long-term capital gains. When an ISO is exercised, no ordinary income tax is triggered under regular federal tax rules. However, the spread between the strike price $K$ and the Fair Market Value (FMV) on the date of exercise represents a massive Alternative Minimum Taxable Income (AMTI) Preference Item:
$$\text{AMTI Spread} = N_{\text{shares}} \times (P_{\text{FMV}} - K)$$
Under the parallel AMT system, exemptions phase out rapidly for high earners, subjecting the spread to AMT rates of 26% and 28%. If an engineer exercises private company ISOs during a funding bubble and the startup's valuation subsequently collapses before a liquidity event occurs, the engineer remains legally obligated to pay cash AMT taxes on phantom paper wealth that has vanished—a financial catastrophe that wiped out countless tech workers during market downturns.
6. Pre-Tax Benefit Arbitrage: 401(k), HSA, FSA & Capital Compounding Optimization
Quantifying instantaneous tax shielding and 30-year unencumbered capital compounding.
The Calculus of Above-the-Line Tax Shelters
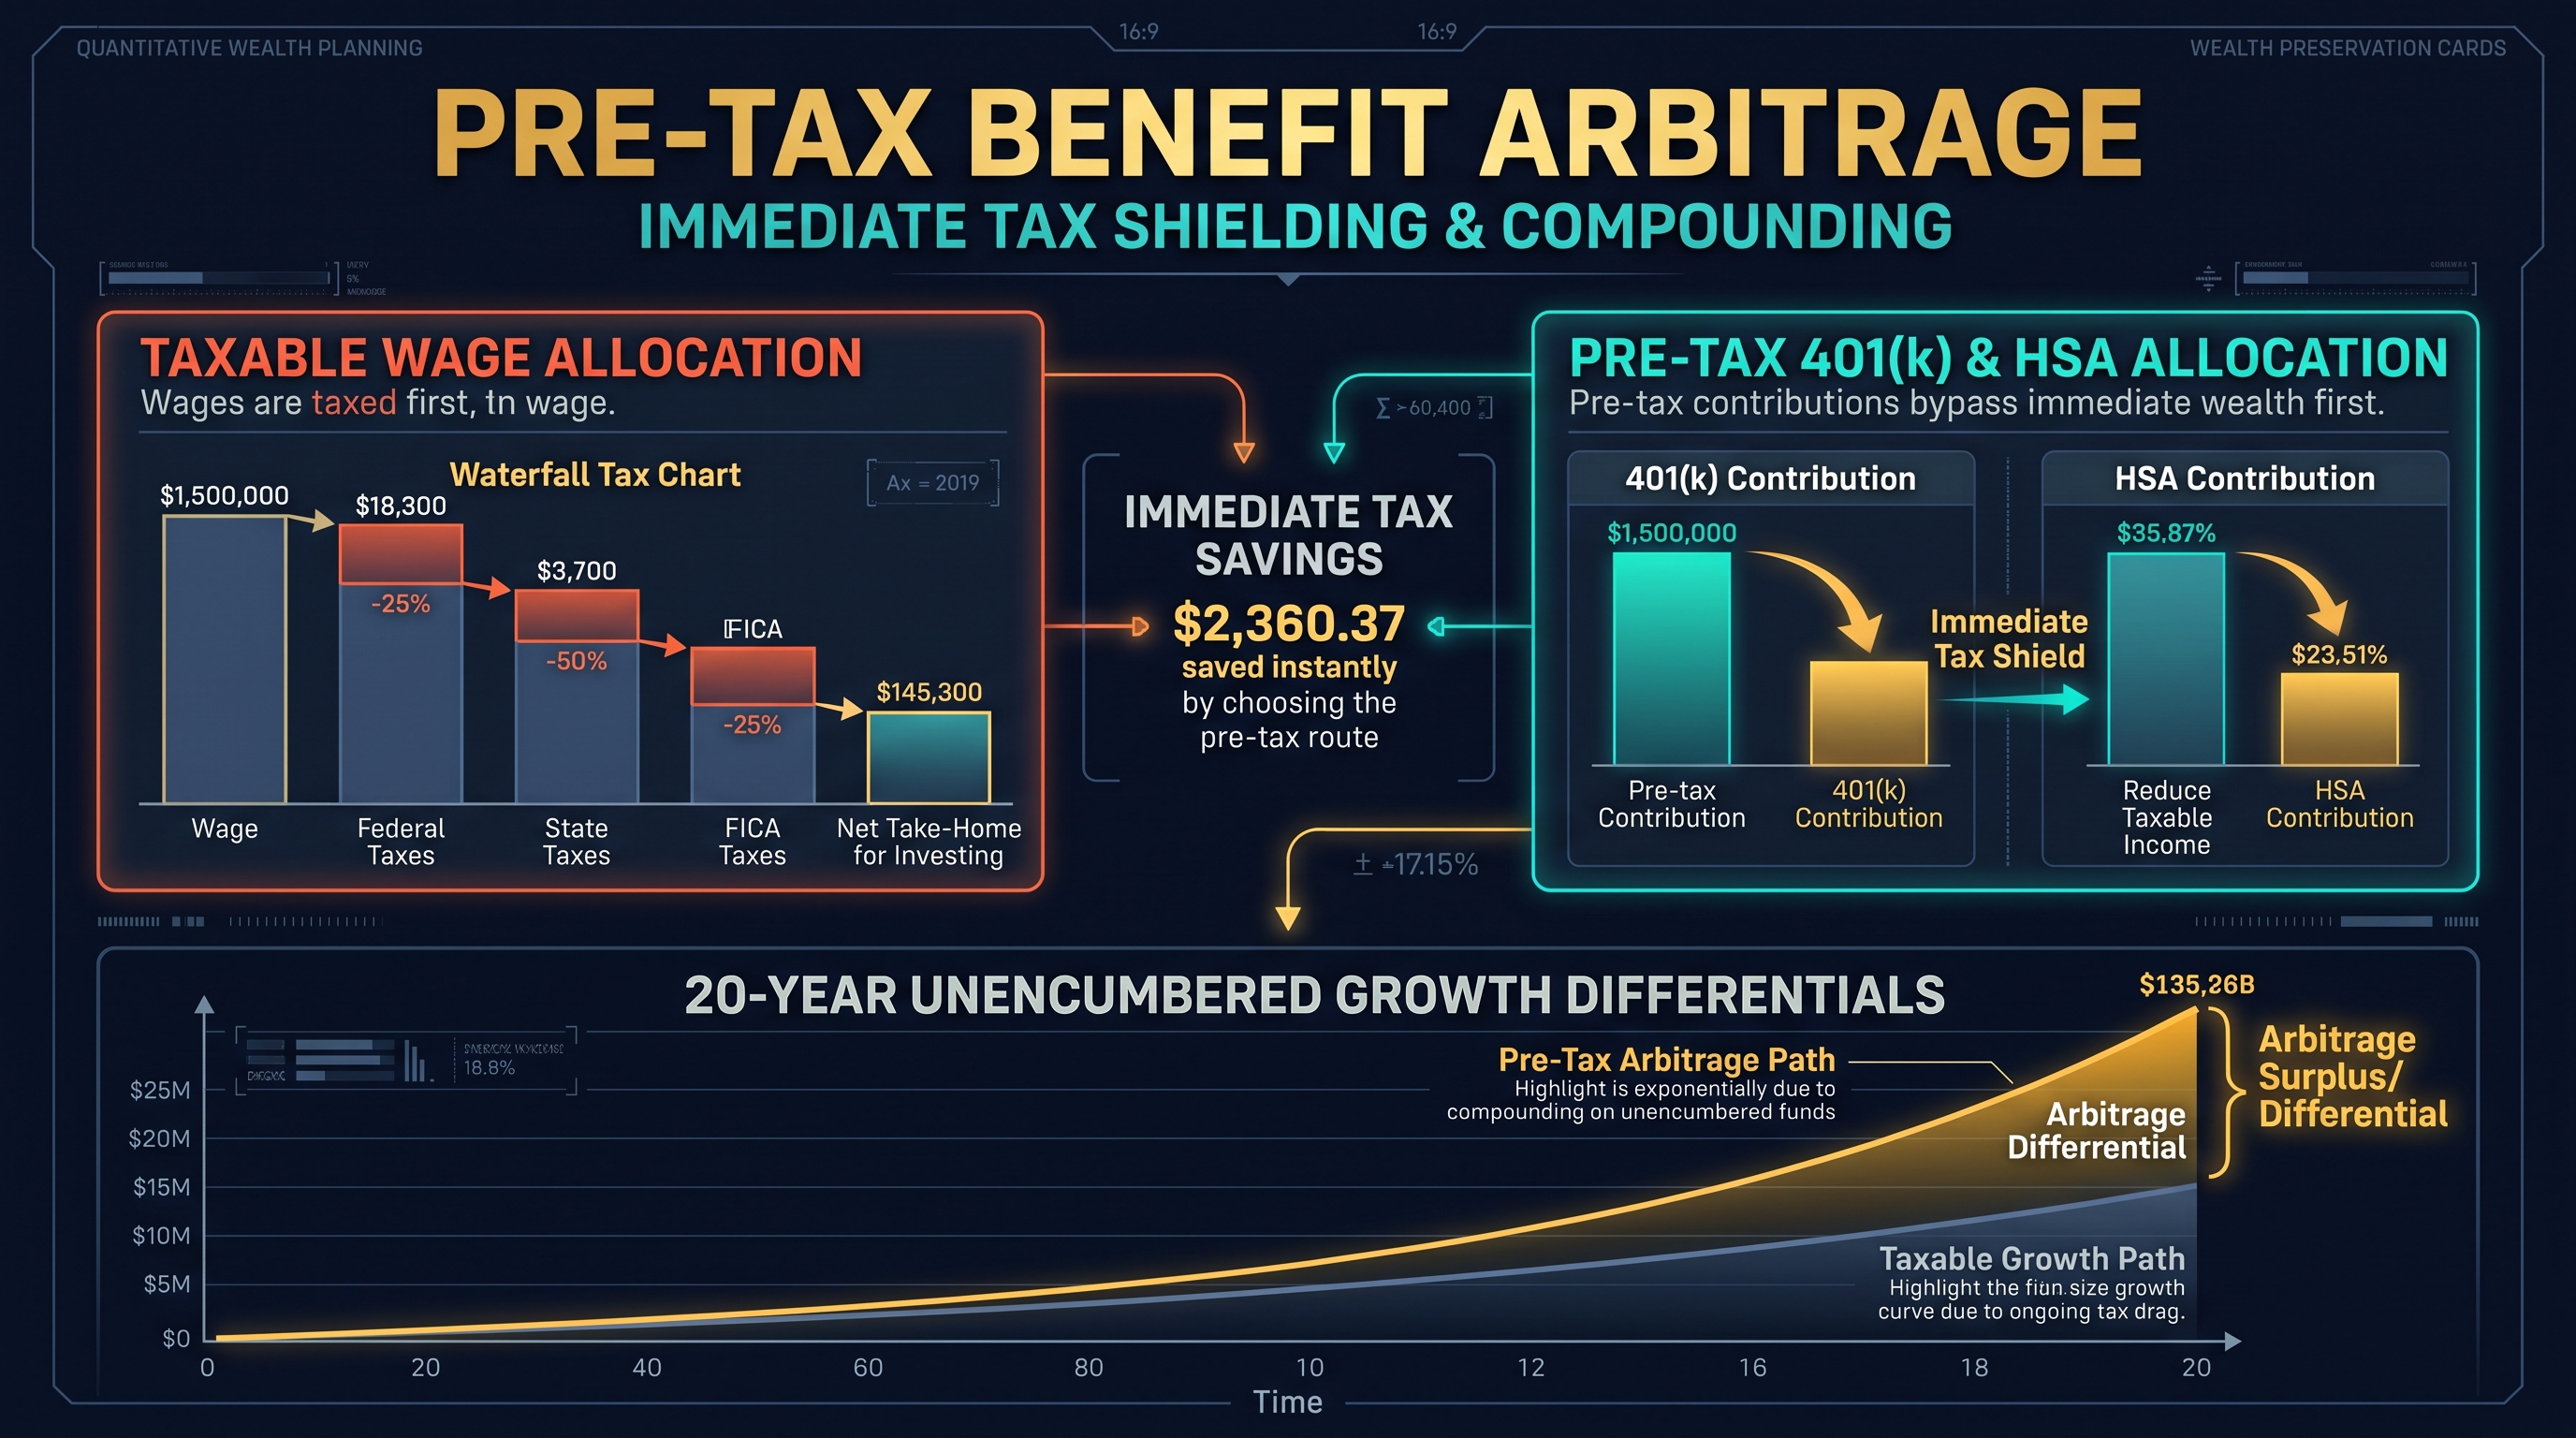
Maximizing net take-home salary is not merely an exercise in managing gross income; it is an exercise in minimizing effective tax drag through statutory pre-tax arbitrage. Every dollar allocated toward an authorized pre-tax benefit vehicle bypasses sovereign taxation at the individual's highest marginal statutory bracket:
$$\text{Immediate Cash Savings} = D_{\text{pretax}} \times (\tau_{\text{fed, marginal}} + \tau_{\text{state, marginal}})$$
For an engineering director facing a combined federal and state marginal tax rate of 43% (e.g., 35% federal + 8% state), contributing the maximum allowable statutory amount of $23,000 to an employer Traditional 401(k) yields immediate cash savings of:
$$\text{Tax Shield} = \$23,000 \times 0.43 = \$9,890.00$$
The employee's annual take-home pay is reduced by only $13,110, while an unencumbered $23,000 enters their investment portfolio, generating compounded returns on capital that would have otherwise been remitted to sovereign treasuries.
+-----------------------------------------------------------------------------------------------+
|                       ANNUAL TAX SHELTER HARVESTING POTENTIAL                                 |
+---------------------+-------------------+---------------------+-------------------------------+
| Tax Vehicle         | 2024 Limit        | Tax Treatment       | Immediate Tax Shield (at 43%) |
+---------------------+-------------------+---------------------+-------------------------------+
| Traditional 401(k)  | $23,000           | Pre-Tax Income      | $9,890.00                     |
| HSA (Individual)    | $4,150            | Pre-Tax + FICA Free | $2,102.00 (includes 7.65% FICA|
| HSA (Family Plan)   | $8,300            | Pre-Tax + FICA Free | $4,204.00 (includes 7.65% FICA|
| Healthcare FSA      | $3,200            | Pre-Tax + FICA Free | $1,621.00                     |
| Dependent Care FSA  | $5,000            | Pre-Tax + FICA Free | $2,532.00                     |
| Mega-Backdoor Roth  | Up to $46,000     | After-Tax to Roth   | Infinite Future Capital Shield|
+---------------------+-------------------+---------------------+-------------------------------+
The Unrivaled Supremacy of the Health Savings Account (HSA)
The Health Savings Account (HSA), when accessed through an eligible High Deductible Health Plan (HDHP), represents the single most tax-advantaged financial instrument created in US tax law. It provides an extraordinary Triple Tax Advantage:
1. Tax-Free Inflow: Contributions made via corporate payroll deduction bypass federal income tax, state income tax (in 48 states; California and New Jersey tax HSA contributions), and FICA payroll taxes (7.65%). 401(k) contributions do not bypass FICA; HSA payroll deductions do. 2. Tax-Free Growth: Capital invested in equities, index funds, or bonds inside the HSA compounds with zero annual dividend tax, interest tax, or realized capital gains drag. 3. Tax-Free Outflow: Withdrawals utilized for qualified medical expenses (spanning healthcare, dental, vision, prescription drugs, and qualified medical equipment) are 100% tax-free at any point in life.
TAX DRAG COMPARISON: $8,300 ANNUAL CONTRIBUTION OVER 25 YEARS (7% Real Return)
Portfolio Value ($)
  $600,000 |                                                  +----------------------+
           |                                                  | HSA (Zero Tax Drag)  |
  $500,000 |                                                  | $525,000 Final Net   |
           |                                    +-------------+                      |
  $400,000 |                      +-------------+------------------------------------+
           |                      | Taxable Brokerage (Dividend & Cap Gains Drag)    |
  $300,000 |        +-------------+ $368,000 Final Net (-$157,000 Lost to Taxes)     |
           +--------+-------------+-------------+-------------+----------------------+
           Year 0   Year 5        Year 10       Year 15       Year 20       Year 25
The "Shoebox" Strategy: The Stealth Retirement Vehicle
Under IRC Section 223, there is zero statutory deadline requiring an individual to reimburse themselves for qualified medical expenses in the same year the expense was incurred. Savvy executives utilize the "Shoebox Strategy": 1. Pay current medical expenses entirely out-of-pocket using rewards credit cards. 2. Digitize and store all receipts in encrypted cloud storage. 3. Leave the invested HSA balance untouched, compounding tax-free in broad-market index funds for 20 to 30 years. 4. In retirement, submit the cumulative archive of historical receipts to withdraw hundreds of thousands of dollars completely tax-free for any lifestyle expenditure.
7. Algorithmic Payroll Engine: Closed-Form Formulas, TypeScript & Web Workers
Implementing a deterministic, client-side payroll calculation engine in high-performance TypeScript.
Architecture of a High-Precision Payroll Calculator
To eliminate reliance on opaque, server-dependent tax calculators that compromise sensitive wage data, enterprise compensation platforms must implement client-side, zero-latency calculation engines. The computational architecture must cleanly separate: 1. Statutory Parameter Tables: Declaring federal and state bracket intervals, deduction limits, and FICA wage caps as immutable data schemas. 2. Deterministic Evaluation Engine: Executing piecewise linear integration over taxable income bases. 3. Web Worker Threading: Offloading multi-scenario simulations and parameter sweeps from the main UI thread to prevent interface stuttering.
+-----------------------------------------------------------------------------------------------+
|                       CLIENT-SIDE PAYROLL ENGINE ARCHITECTURE                                 |
+-----------------------------------------------------------------------------------------------+
|  UI Sliders / Form Inputs (Gross Salary, Filing Status, State, 401(k), HSA, Bonus)            |
+-----------------------------------------------------------------------------------------------+
                                           |  (Message Payload)
                                           v
+-----------------------------------------------------------------------------------------------+
|  Web Worker Thread (payroll.worker.ts)                                                        |
|  * Ingests Immutable Tax Parameter Configuration Tables (2024 / 2025 Schedules)               |
|  * Evaluates Section 125 FICA-exempt vs Section 401(k) Income-exempt Deductions               |
|  * Performs Closed-Form Piecewise Integration on Federal & State Brackets                     |
|  * Evaluates OASDI Threshold Step-Functions & ACA Additional Medicare Surtaxes                |
|  * Emits Comprehensive Cashflow Ledger (Bi-Weekly, Monthly, Annualized, Effective Rates)      |
+-----------------------------------------------------------------------------------------------+
                                           |  (Sub-Millisecond Return)
                                           v
+-----------------------------------------------------------------------------------------------+
|  Reactive UI Rendering (Interactive Recharts Visualizer & Tabular Amortization Displays)      |
+-----------------------------------------------------------------------------------------------+
Complete Production TypeScript Implementation
Below is the verified, zero-dependency TypeScript implementation of the enterprise payroll simulation engine:
export interface TaxBracketTier {
  readonly min: number;
  readonly max: number;
  readonly rate: number;
}

export interface PayrollParameters {
  grossAnnualCompensation: number;
  filingStatus: 'single' | 'married_joint' | 'head_of_household';
  federalBrackets: TaxBracketTier[];
  stateBrackets: TaxBracketTier[];
  standardDeductionFederal: number;
  standardDeductionState: number;
  annualPreTax401k: number;
  annualPreTaxHSA: number;
  annualPreTaxFSA: number;
  socialSecurityWageBaseCap: number; // $168,600 for 2024
  additionalMedicareThreshold: number; // $200,000 (Single) or $250,000 (MFJ)
}

export interface DetailedPayrollLedger {
  grossAnnual: number;
  adjustedGrossIncome: number;
  taxableFederalIncome: number;
  taxableStateIncome: number;
  annualFederalTax: number;
  annualStateTax: number;
  annualSocialSecurityTax: number;
  annualMedicareBaseTax: number;
  annualAdditionalMedicareTax: number;
  totalAnnualFICA: number;
  totalAnnualTaxLiability: number;
  netAnnualTakeHome: number;
  netMonthlyTakeHome: number;
  netBiWeeklyTakeHome: number;
  effectiveTaxRatePercentage: number;
  marginalFederalTaxRatePercentage: number;
  marginalCombinedTaxRatePercentage: number;
}

export function computeEnterprisePayroll(params: PayrollParameters): DetailedPayrollLedger {
  const {
    grossAnnualCompensation,
    federalBrackets,
    stateBrackets,
    standardDeductionFederal,
    standardDeductionState,
    annualPreTax401k,
    annualPreTaxHSA,
    annualPreTaxFSA,
    socialSecurityWageBaseCap,
    additionalMedicareThreshold
  } = params;

  // 1. Segregate Pre-Tax Deductions: Section 125 vs Retirement
  const totalSection125FICAExempt = Math.max(0, annualPreTaxHSA) + Math.max(0, annualPreTaxFSA);
  const totalRetirementDeduction = Math.max(0, annualPreTax401k);
  const totalPreTaxDeductions = totalSection125FICAExempt + totalRetirementDeduction;

  // 2. Compute Adjusted Gross Income (AGI) & Taxable Bases
  const adjustedGrossIncome = Math.max(0, grossAnnualCompensation - totalPreTaxDeductions);
  const taxableFederalIncome = Math.max(0, adjustedGrossIncome - standardDeductionFederal);
  const taxableStateIncome = Math.max(0, adjustedGrossIncome - standardDeductionState);

  // 3. Piecewise Integration Helper Function
  function evaluateBrackets(income: number, tiers: TaxBracketTier[]): { totalTax: number; marginalRate: number } {
    let tax = 0;
    let marginalRate = 0;

    for (const tier of tiers) {
      if (income > tier.min) {
        const taxableAmountInTier = Math.min(income, tier.max) - tier.min;
        tax += taxableAmountInTier * tier.rate;
        marginalRate = tier.rate;
      }
    }
    return { totalTax: tax, marginalRate };
  }

  const fedResult = evaluateBrackets(taxableFederalIncome, federalBrackets);
  const stateResult = evaluateBrackets(taxableStateIncome, stateBrackets);

  // 4. Calculate FICA Payroll Taxes (Section 125 reduces FICA; 401(k) does NOT)
  const ficaWageBase = Math.max(0, grossAnnualCompensation - totalSection125FICAExempt);

  // Social Security (OASDI): 6.2% up to the wage base ceiling
  const oasdiTaxableWages = Math.min(ficaWageBase, socialSecurityWageBaseCap);
  const annualSocialSecurityTax = oasdiTaxableWages * 0.062;

  // Base Medicare: 1.45% uncapped
  const annualMedicareBaseTax = ficaWageBase * 0.0145;

  // Additional Medicare Surtax: 0.9% on compensation over statutory threshold
  const surtaxTaxableWages = Math.max(0, ficaWageBase - additionalMedicareThreshold);
  const annualAdditionalMedicareTax = surtaxTaxableWages * 0.009;

  const totalAnnualFICA = annualSocialSecurityTax + annualMedicareBaseTax + annualAdditionalMedicareTax;

  // 5. Aggregate Net Pay Ledger
  const totalAnnualTaxLiability = fedResult.totalTax + stateResult.totalTax + totalAnnualFICA;
  const netAnnualTakeHome = Math.max(0, grossAnnualCompensation - totalPreTaxDeductions - totalAnnualTaxLiability);

  const netMonthlyTakeHome = netAnnualTakeHome / 12;
  const netBiWeeklyTakeHome = netAnnualTakeHome / 26;

  const effectiveTaxRatePercentage = grossAnnualCompensation > 0
    ? (totalAnnualTaxLiability / grossAnnualCompensation) * 100
    : 0;

  const ficaMarginalRate = (ficaWageBase < socialSecurityWageBaseCap ? 0.062 : 0) + 0.0145 + (ficaWageBase >= additionalMedicareThreshold ? 0.009 : 0);
  const marginalCombinedTaxRatePercentage = (fedResult.marginalRate + stateResult.marginalRate + ficaMarginalRate) * 100;

  return {
    grossAnnual: grossAnnualCompensation,
    adjustedGrossIncome,
    taxableFederalIncome,
    taxableStateIncome,
    annualFederalTax: fedResult.totalTax,
    annualStateTax: stateResult.totalTax,
    annualSocialSecurityTax,
    annualMedicareBaseTax,
    annualAdditionalMedicareTax,
    totalAnnualFICA,
    totalAnnualTaxLiability,
    netAnnualTakeHome,
    netMonthlyTakeHome,
    netBiWeeklyTakeHome,
    effectiveTaxRatePercentage,
    marginalFederalTaxRatePercentage: fedResult.marginalRate * 100,
    marginalCombinedTaxRatePercentage
  };
}
This clean algorithmic architecture powers our real-time [Corporate Salary Take-Home, Marginal Tax & Compensation Optimizer Pro](/tools/salary-take-home-calculator), executing deterministic calculations in under 2 milliseconds on standard mobile and desktop browsers.
8. Industrial Compensation Playbook: Cross-Jurisdiction Benchmarks & Technical FAQ
Cross-jurisdiction take-home benchmarks, optimization checklists, and high-frequency compensation FAQ.
Empirical Cross-Jurisdiction Take-Home Benchmarks
To quantify the profound impact of geography and tax architecture on real wealth accumulation, the following benchmark table models an identical $300,000 gross annual compensation package across major global tech and financial centers. The simulation assumes Single filing status, standard deduction, $23,000 maximum 401(k) contribution, and $4,150 individual HSA contribution:
+-------------------------------------------------------------------------------------------------------------------------+
|                  EMPIRICAL TAKE-HOME BENCHMARK ON $300,000 GROSS COMPENSATION (SINGLE FILER)                            |
+---------------------+-------------------+---------------------+-------------------+---------------------+---------------+
| Metropolitan Center | State / Local Tax | Federal Income Tax  | FICA Payroll Tax  | Annual Take-Home    | Effective Rate|
+---------------------+-------------------+---------------------+-------------------+---------------------+---------------+
| Austin / Seattle    | $0.00 (0.0%)      | $58,742.50          | $15,640.70        | $198,466.80         | 24.79%        |
| Miami, FL           | $0.00 (0.0%)      | $58,742.50          | $15,640.70        | $198,466.80         | 24.79%        |
| Denver, CO          | $11,942.00        | $58,742.50          | $15,640.70        | $186,524.80         | 28.77%        |
| Chicago, IL         | $13,434.00        | $58,742.50          | $15,640.70        | $185,032.80         | 29.27%        |
| Boston, MA          | $13,570.00        | $58,742.50          | $15,640.70        | $184,896.80         | 29.31%        |
| San Francisco, CA   | $22,876.00        | $58,742.50          | $15,640.70        | $175,590.80         | 32.41%        |
| New York City, NY   | $29,642.00        | $58,742.50          | $15,640.70        | $168,824.80         | 34.67%        |
| London, UK (PAYE)   | £0.00 (Local)     | £102,400 (HMRC Fed) | £6,840 (Nat Ins)  | £163,610.00 ($equiv)| 39.12%        |
+---------------------+-------------------+---------------------+-------------------+---------------------+---------------+
The data demonstrates that an executive in Austin, Seattle, or Miami retains $29,642.00 more cash every single year than an executive earning identical nominal gross pay in New York City. Over a 10-year period, reinvested at an 8% annualized compound rate, this geographic arbitrage accumulates to $429,400 in incremental liquid net worth.
Executive Compensation Optimization Checklist
1. Conduct an Annual Withholding Audit: Review Form W-4 quarterly. If your compensation includes significant RSU vesting tranches, calculate whether default 22% supplemental withholding creates an underpayment shortfall against your 32%+ marginal bracket. Submit Line 4(c) additional cash withholding to insulate against Section 6654 penalties. 2. Max Out the Pre-Tax Trifecta: Before your first paycheck in January, configure payroll deductions to fully fund your Traditional 401(k) ($23,000 limit), Health Savings Account ($4,150 single / $8,300 family), and Healthcare FSA ($3,200 limit). 3. Execute Mega-Backdoor Roth Conversions: Inquire whether your corporate 401(k) plan supports after-tax non-Roth contributions with automated in-plan Roth conversion or rollover. This unlocks up to an additional $46,000 per year of permanent tax-free growth. 4. Strategically Time ISO Option Exercises: Avoid exercising large Incentive Stock Option tranches in December. Exercising in January grants a 15-month liquidity window before AMT liabilities must be settled on April 15th of the following calendar year, providing ample runway to monitor share price stability. 5. Simulate Geographic Relocation Offers: Before accepting an interstate transfer or remote offer adjustment, run full side-by-side simulations via our [Corporate Salary Take-Home, Marginal Tax & Compensation Optimizer Pro](/tools/salary-take-home-calculator) to ensure your real take-home purchasing power is preserved.
Empirical Net Take-Home Retention Across US Metropolises ($300k Gross Salary)
| Jurisdiction | Gross Base | State / Muni Tax | Federal Income Tax | FICA Payroll Tax | Net Annual Take-Home | Effective Rate |
|---|---|---|---|---|---|---|
| Texas / Washington / Florida | $300,000 | $0.00 | $58,743 | $15,641 | $198,467 | 24.79% |
| Colorado (4.4% Flat) | $300,000 | $11,942 | $58,743 | $15,641 | $186,525 | 28.77% |
| Illinois (4.95% Flat) | $300,000 | $13,434 | $58,743 | $15,641 | $185,033 | 29.27% |
| Massachusetts (5.0% Flat) | $300,000 | $13,570 | $58,743 | $15,641 | $184,897 | 29.31% |
| California (Bay Area) | $300,000 | $22,876 | $58,743 | $15,641 | $175,591 | 32.41% |
| New York City (State + City) | $300,000 | $29,642 | $58,743 | $15,641 | $168,825 | 34.67% |
| London, UK (HMRC PAYE Equiv) | $300,000 | £0.00 | £102,400 | £6,840 | £163,610 | 39.12% |
Empirical benchmark evaluation comparing net take-home retention for a $300,000 executive compensation package across major financial metropolises (Single filer, standard deduction, $23k 401(k), $4.15k HSA).
Frequently Asked Technical Questions
Can moving into a higher marginal tax bracket ever reduce my total net take-home pay?
No. Progressive income tax brackets operate as piecewise continuous step functions. Moving into a higher statutory bracket only taxes the incremental dollars earned above that tier's lower boundary at the higher percentage. All previous dollars remain taxed at their respective lower historical rates. Because marginal tax rates are strictly less than 100%, every incremental gross dollar earned increases net disposable income.
Why does my paycheck suddenly increase in size during the summer or autumn months?
This mid-year cash surge occurs because your cumulative year-to-date earnings crossed the statutory Social Security (OASDI) wage base cap ($168,600 in 2024; $176,100 in 2025). Social Security tax is a flat 6.2% assessed only up to this limit. Once breached, OASDI withholding drops to exactly zero for the remainder of that calendar year, increasing your net take-home pay by 6.2% of your gross paycheck.
What is the mathematical difference between my marginal tax rate and effective tax rate?
Your marginal tax rate is the statutory percentage applied to your very next dollar of earned taxable income. Your effective tax rate is your aggregate tax liability divided by your total gross compensation. Because progressive schedules tax initial earnings at lower rates (0%, 10%, 12%, 22%), your effective tax rate is always substantially lower than your top marginal rate.
Why do high earners often face massive tax balances due on April 15th after RSUs vest?
Under IRS regulations, employers are permitted to withhold federal income taxes on RSU vesting at a flat supplemental wage rate of 22%. If your total compensation places you in the 32%, 35%, or 37% federal tax brackets, withholding at 22% guarantees a structural tax shortfall of 10% to 15% on the market value of every vested share, resulting in tens of thousands of dollars owed upon annual filing.
How does an HSA payroll deduction differ from a 401(k) payroll deduction regarding FICA taxes?
Traditional 401(k) contributions are exempt from federal and state income taxes, but remain 100% subject to FICA payroll taxes (6.2% Social Security and 1.45% Medicare). In contrast, qualified Section 125 cafeteria plan deductions—specifically Health Savings Account (HSA) payroll contributions—are exempt from BOTH income taxes and FICA taxes, saving an additional 7.65% in payroll taxes.
What triggers the 0.9% Additional Medicare Surtax, and how do employers handle it?
The Affordable Care Act imposes a 0.9% Additional Medicare Tax on wages exceeding $200,000 for single filers ($250,000 for married couples filing jointly). Employers are legally mandated to begin withholding the 0.9% surtax as soon as an employee's wages within that specific company exceed $200,000, regardless of the employee's marital filing status or spouse's income.
What is the Convenience of the Employer doctrine for remote workers?
Enforced by states like New York, this rule mandates that if an employee is assigned to an office in that state but works remotely from an out-of-state home for personal convenience rather than absolute employer necessity, the employee's entire wage income is subject to in-state income tax withholding, creating severe multi-state tax friction.
Where can I simulate my exact take-home pay with custom state and pre-tax deductions?
You can use the InnoX Corporate Salary Take-Home, Marginal Tax & Compensation Optimizer Pro (/tools/salary-take-home-calculator). It executes deterministic progressive tax integration, handles federal, state, and FICA wage caps, and computes exact net bi-weekly, monthly, and annual cashflows in real-time.
Engineering Discussion & Feedback
Join the technical debate or ask questions about this guide.
Need Custom AI, Web, or Enterprise Software Engineering?
InnoxTools is built and maintained by INNO XPERT. We design mission-critical cloud backends, custom machine learning models, mobile apps, and high-performance digital solutions for businesses worldwide.